Intro
Climate change poses one of humanity's greatest threats now and in the future. Changes in global weather patterns, sea level rises, and more intense storms threaten our safety and prosperity. These threats will continue to loom over us until we reduce or eliminate our need to burn fossil fuels.
Countries and organizations around the world recognize the threat of climate change and have invested more and more in renewable energy sources to help ween ourselves off from fossil fuels. In March 2018, Portugal produced enough renewable energy to power the entire country. Then in April 2018, the UK went 44 hours without burning coal for the first time since the beginning of the Industrial Revolution (1760). In the same month, Apple Inc., the largest company in the world by market capitalization, announced that their company operations now run on 100% renewable energy. Unfortunately, Portugal, Apple, and the like are the exceptions.
The majority of countries and companies still depend heavily on burning fossil fuels. Coal and natural gas stations generate most of our electricity, and nearly all our vehicles, airplanes, and ships run on oil. The latest advances in renewable technologies have yet to be distributed to most of the world, and the infrastructure to make full use of them are still limited to the most industrialized nations. Humanity has made massive strides to fight our addiction to fossil fuels, but the journey has just begun.
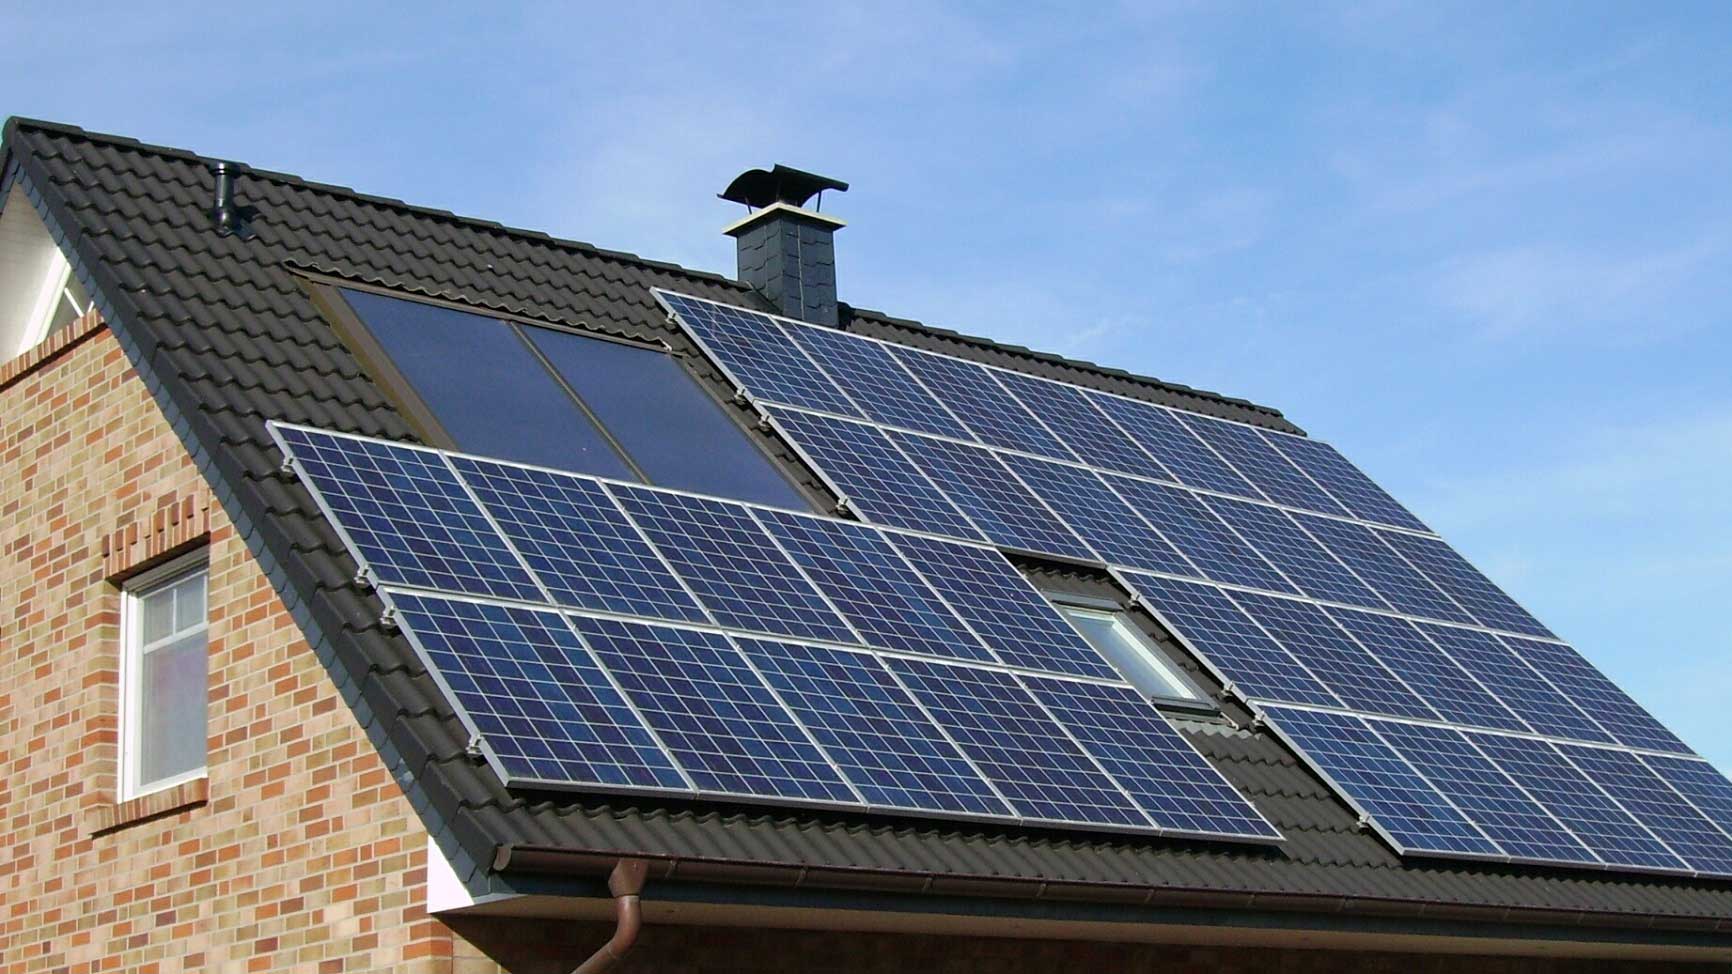
Solar Power
Every 90 minutes, the sunlight strikes the Earth's surface with about 480 quintillion (18 zeros) joules of energy. For comparison, the world uses about 430 quintillion joules of energy in an entire year. In other words, there's a more than enough solar power to meet out energy demands.
With today's technology, all it takes to power the entire world with solar power are photovoltaic panels that cover an area measuring 335 by 335 kilometers, or about 112,000 square kilometers (43,000 square miles). That's about the size of the country of Honduras.
112,000 square kilometers of land isn't a throwaway amount of earth, and it's probably not a good idea to cover all of Honduras with solar panels. But here's another perspective. The Sahara Desert is the world's largest desert outside of the polar areas. It's mostly inhospitable for humans: it's unbearingly dry, hot, and most importantly, very sunny. The Sahara Desert covers an area around 9,200,000 sq kilometers (3,600,000 sq miles), so we'd only need to cover about 1.2% of this massive inhospitable desert with solar panels to meet the world's demand for energy.
Outlook
Solar power is the world's fastest growing source of new energy. It overtook coal as the leading source of new global energy for the time in 2016 and will continue to be the leader in this regard for many more years while growing at an aveage rate of about 33% per year.
Despite solar power's spectacular growth in recent years, as of 2018, solar power provides little more than 1% of global electricity generation. But experts like the International Energy Agency predict that by 2050, solar power could grow enough to supply up to 16% of global electricity demand and become the world's largest single source of electricity.
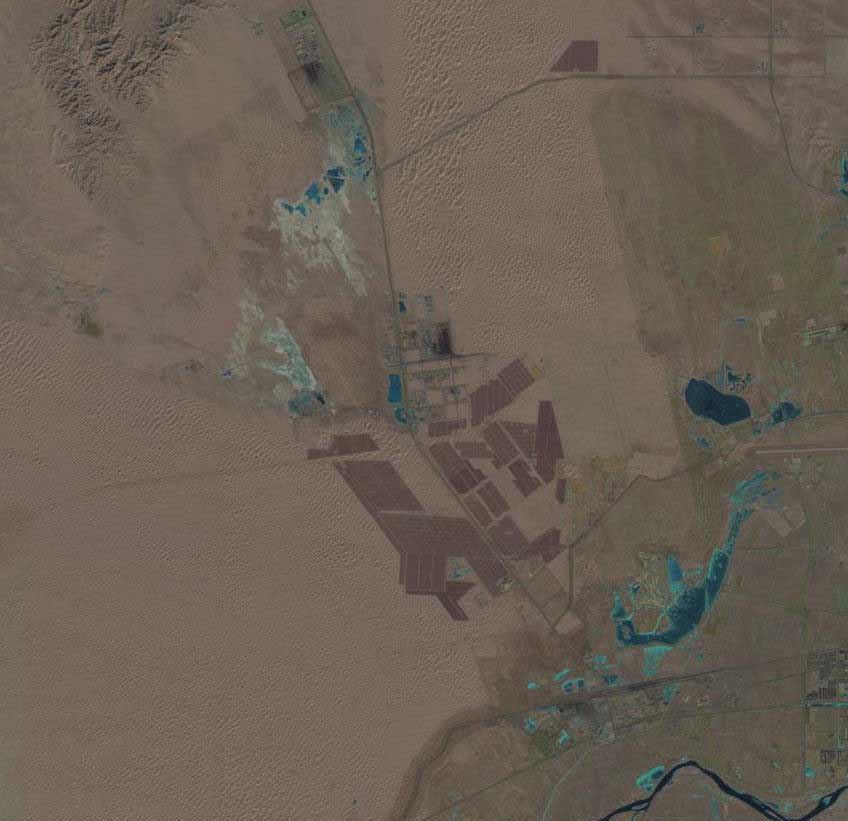
Largest Solar Power Station in the world
The largest photovoltaic power station in the world is China's Tengger Desert Solar Park. The facility was completed in 2016 and is located in the city of Zhongwei. Tengger Desert Solar Park covers an area of 34 km2 and has a total energy capacity of 1,546 MW. That means it can supply power for up to 600,000-700,000 homes.
References
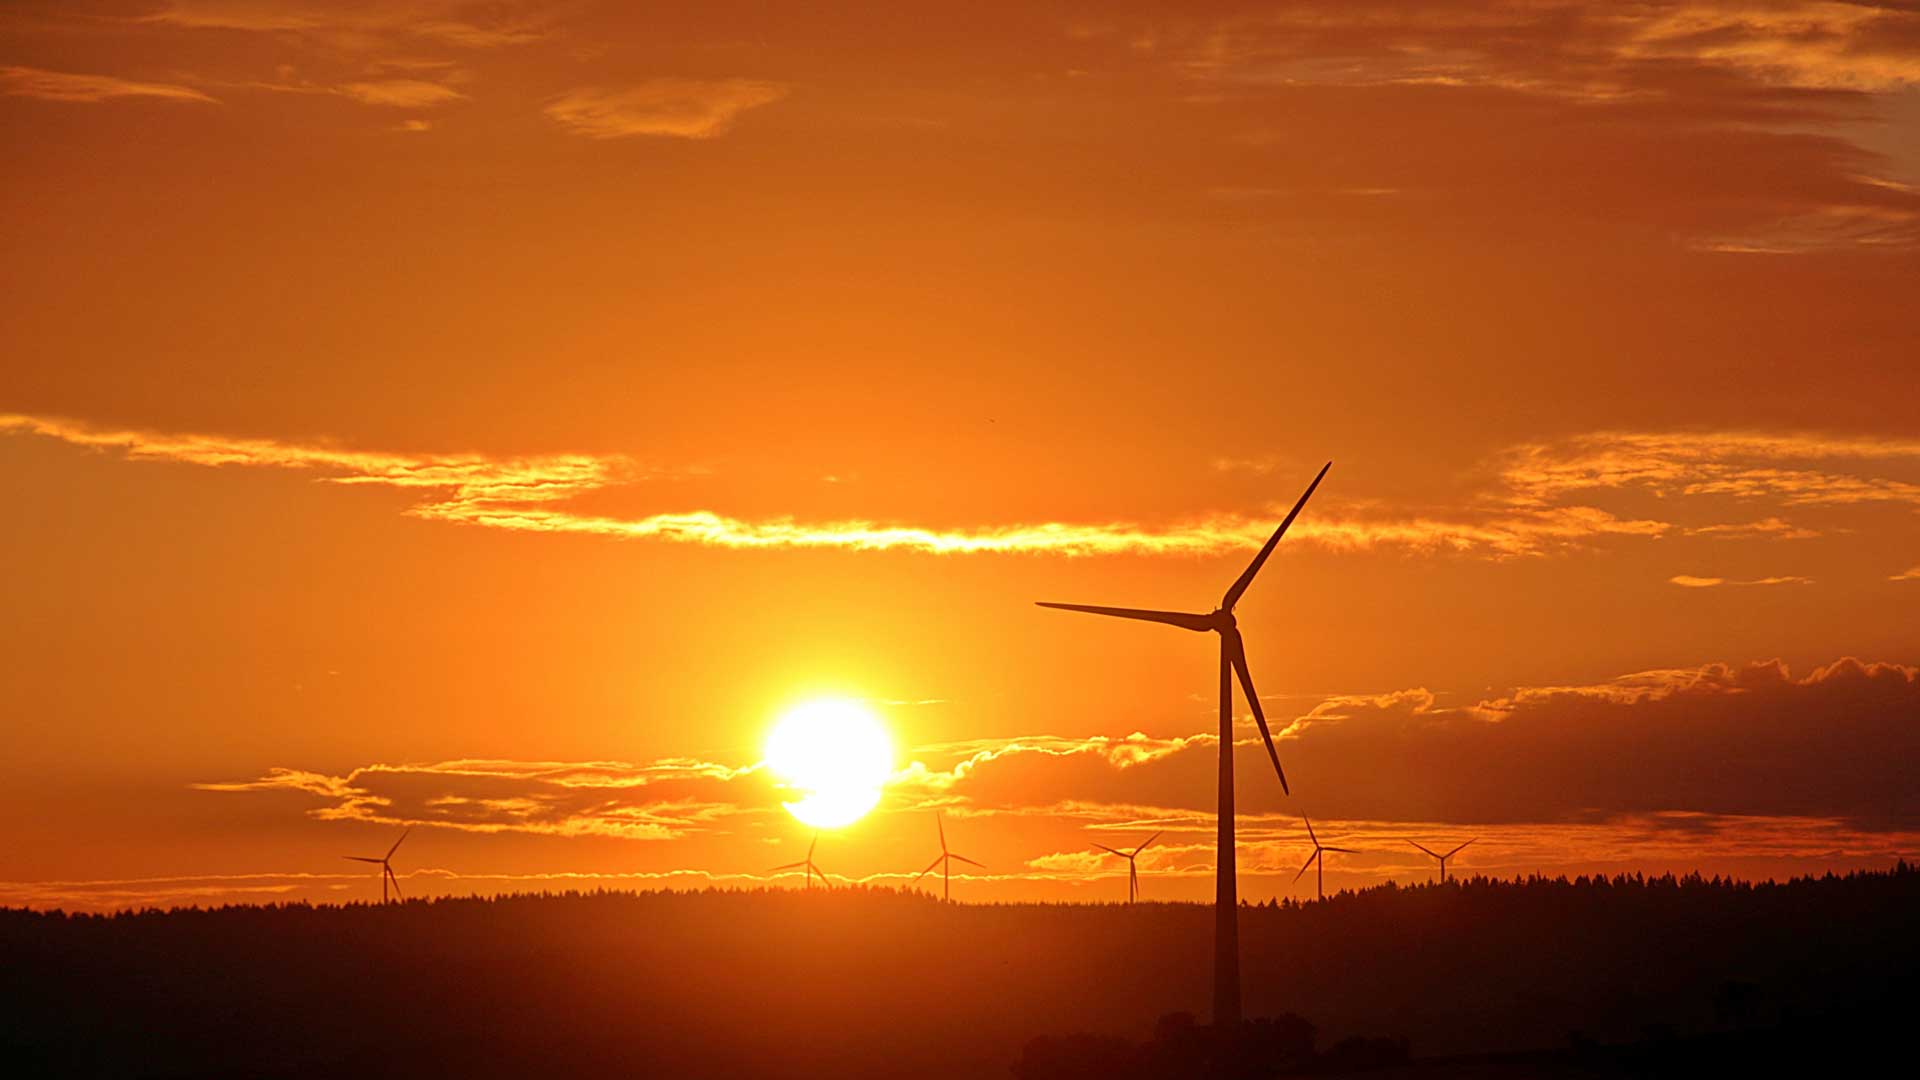
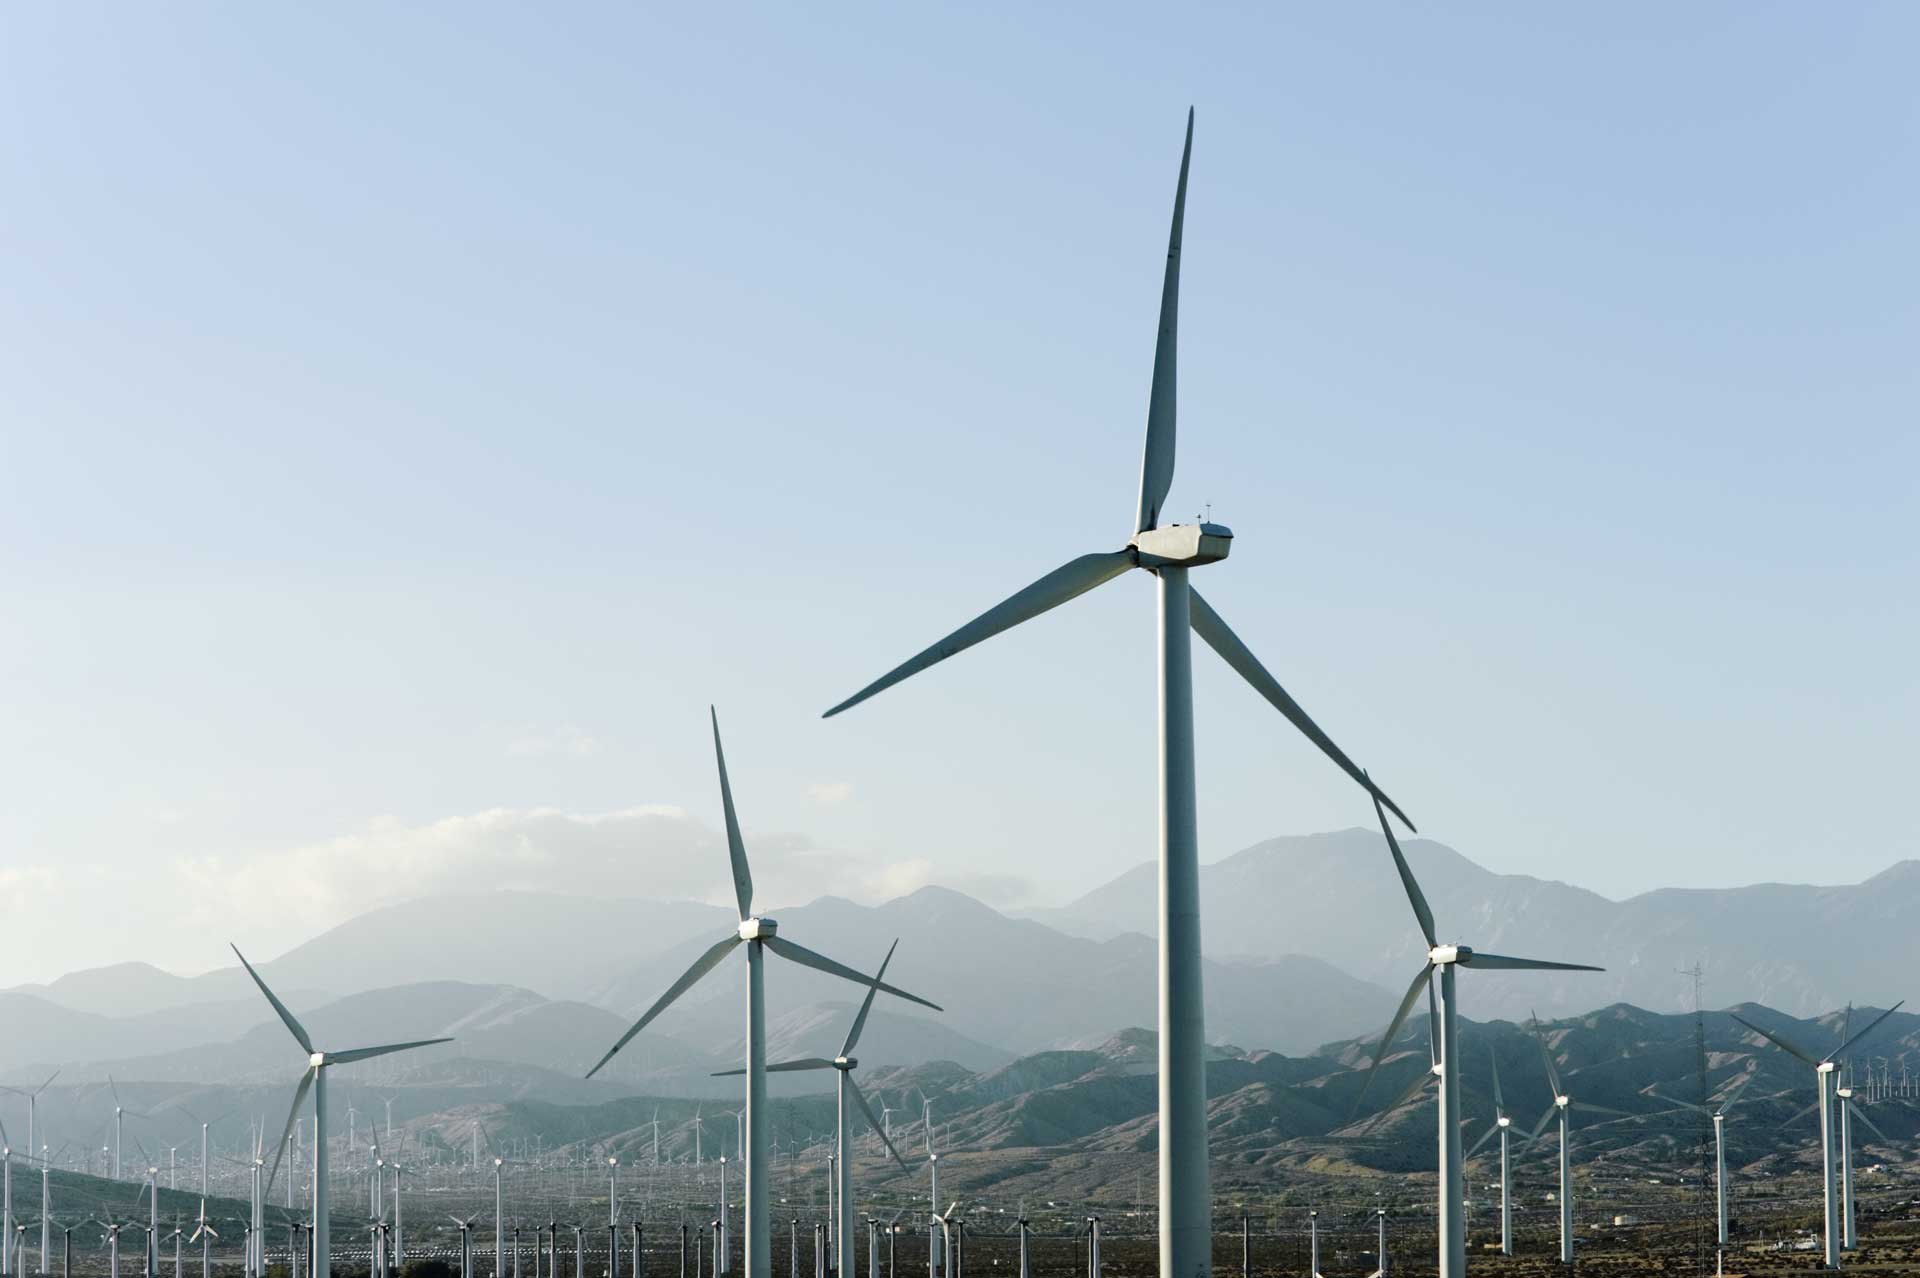
Wind Power
Like sunlight, wind power has a ton of potential. Simulations cap the potential of wind power at around 400 TW with current technology, which could easily meet our present energy demands (the global usage in 2017 was about 18 TW). However it wouldn't be a good idea to fully utilize the world's wind. Capturing anything more than 7.5 TW of wind power could disrupt global wind currents and contribute to unpredictable weather patterns.
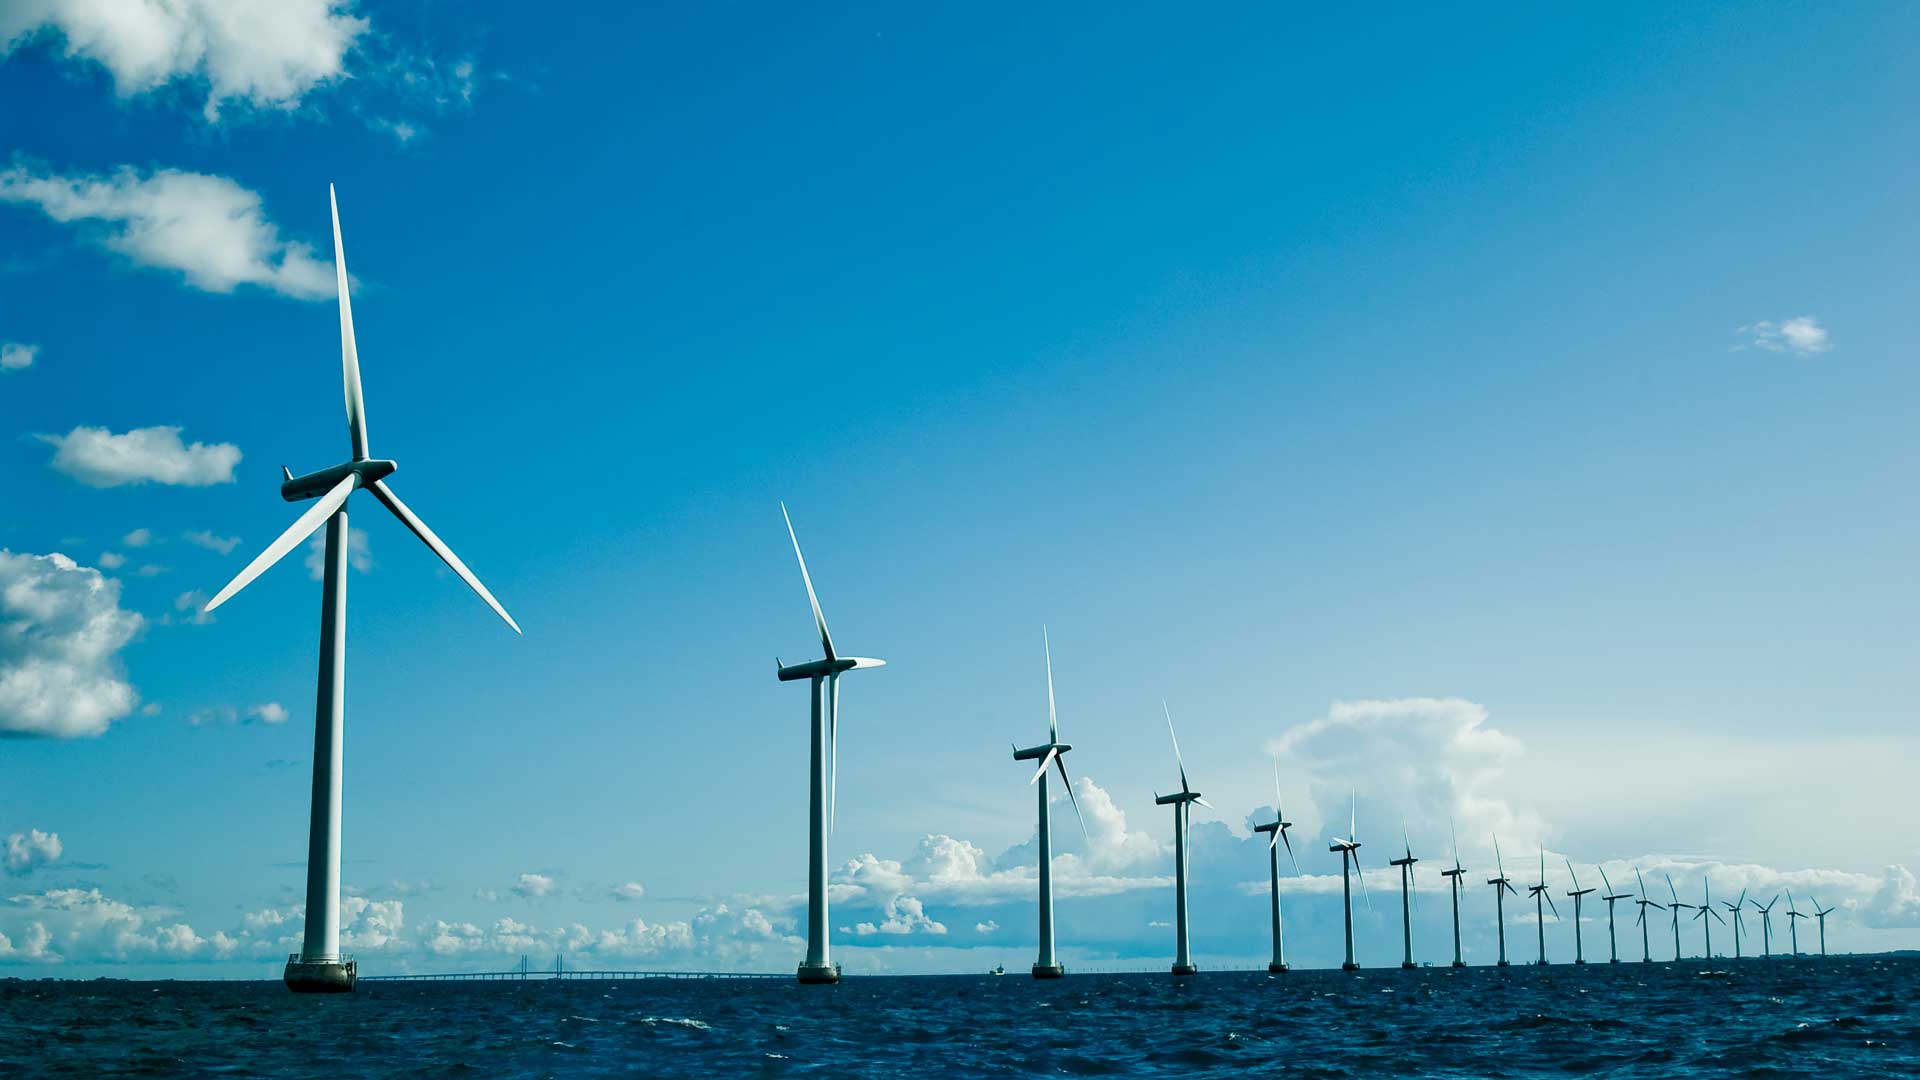
Outlook
In 2017, the worldwide capacity of wind power stands at 540 GW. This meets around 4% of world electricity demands. But like renewable energy sources such as hydro and solar, wind power is rapidly expanding. Since 2006, total wind power capacity has grown over 725% worldwide and shows no signs of slowing down. By 2050, wind and solar power could meet more than 1/3 of electricity demands.
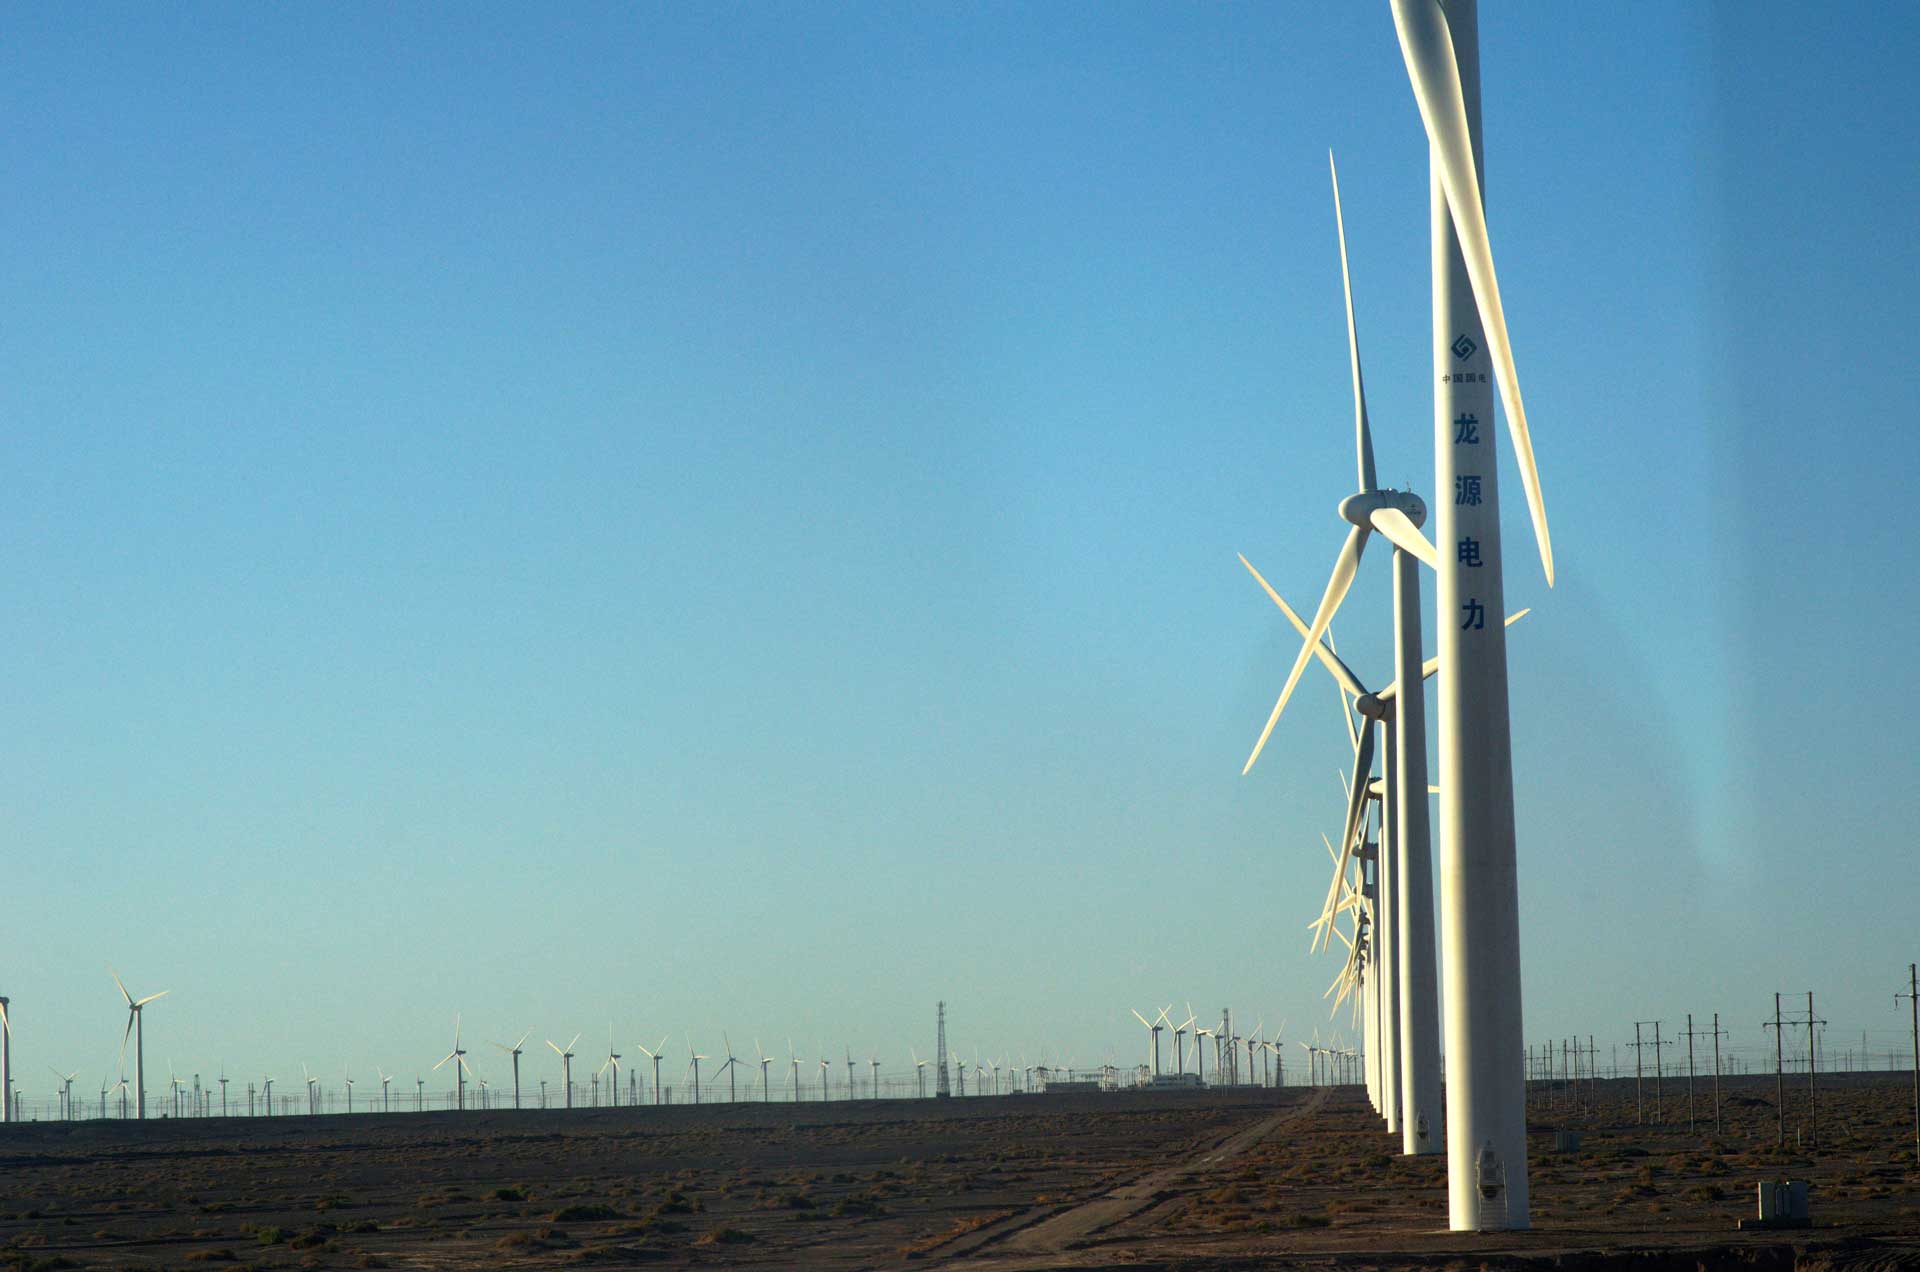
Largest Wind Farm in the World
By far the largest wind farm in the world in terms of energy capacity is the Gansu Wind Farm located in the Gobi Desert of western China.
The entire wind farm complex currently has a capacity of 8 GW, which means it produces around the same amount of electricty as the largest nuclear power plant ever built, the Kashiwazaki-Kariwa Nuclear Power Plant in Japan, which had a capacity of 7,965 MW but was decomissioned after the 2011 Tōhoku earthquake and tsunami disaster.
What's interesting about the complex is that it's not yet complete. There are plans to increase capacity to 20 GW by 2020. Upon completion, the Gansu Wind Farm will be the second single largest power station in the world after the Three Gorges Dam.
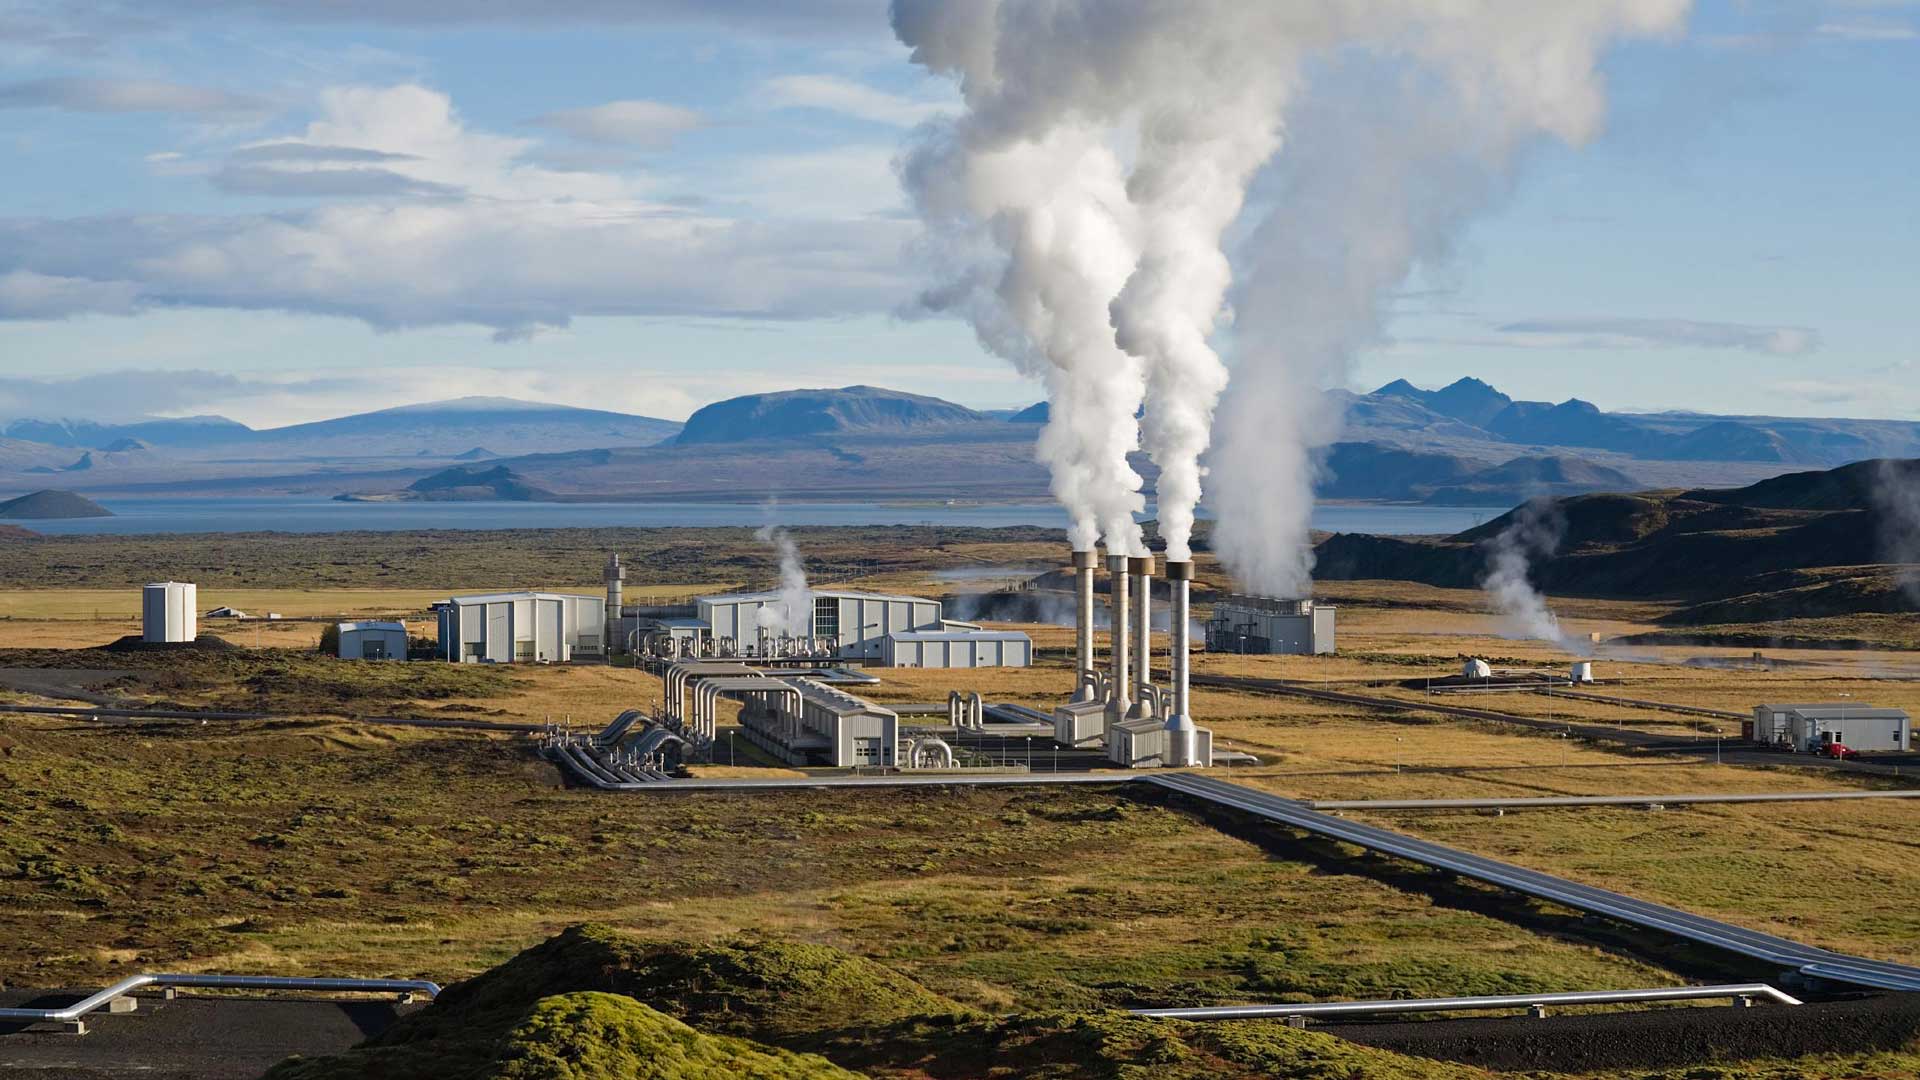
Geothermal Power
Geothermal power stations produce electricity using heat generated and stored in the Earth. The core runs of the Earth runs at a temperature of 6,000 degrees C (10,700 degrees F), which is hotter than the surface of the sun. It's estimated that the Earth's core emits about 10^31 joules, and the heat flows towards the surface at a rate of 44.2 TW. That's enough energy to meet more than twice humanity's annual energy needs (the global usage in 2017 was about 18 TW).
In 2015, we've managed to produce about 12.8 GW of geothermal energy worlwide, and geothermal energy production has been growing at a steady annual rate of 5% from 2012-2015. However, geothermal energy production is still limited. Only 24 countries produce geothermal energy and 28% of that production is in the US.
Outlook
The Geothermal Energy Association estimates that we've only tapped about 6.5% of the global potential for geothermal power (which means we could produce at least 2 TW of geothermal electricity using just current technology). Only 24 countries currently produce geothermal energy, but there are ongoing projects to implement geothermal technology throughout 80 countries. By 2020, the total capacity for geothermal energy will reach around 14.5-17.6 GW.
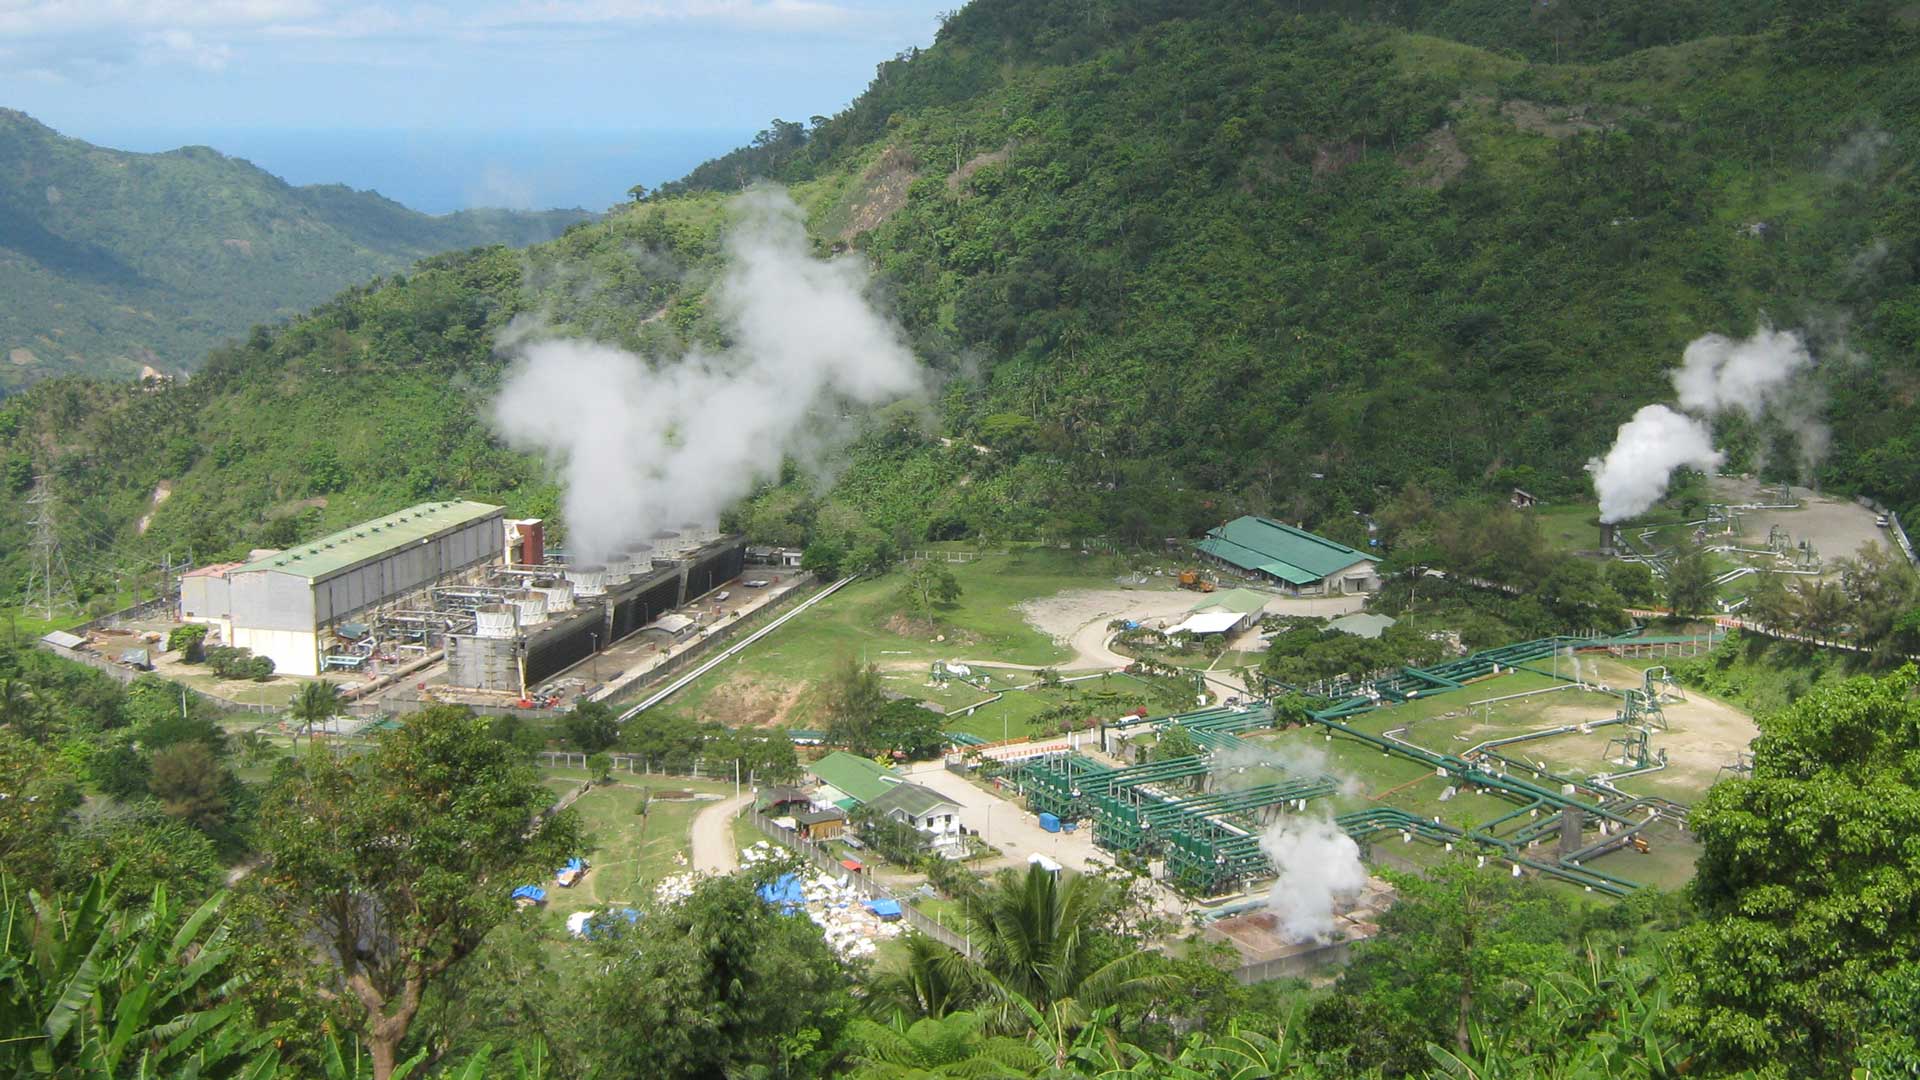
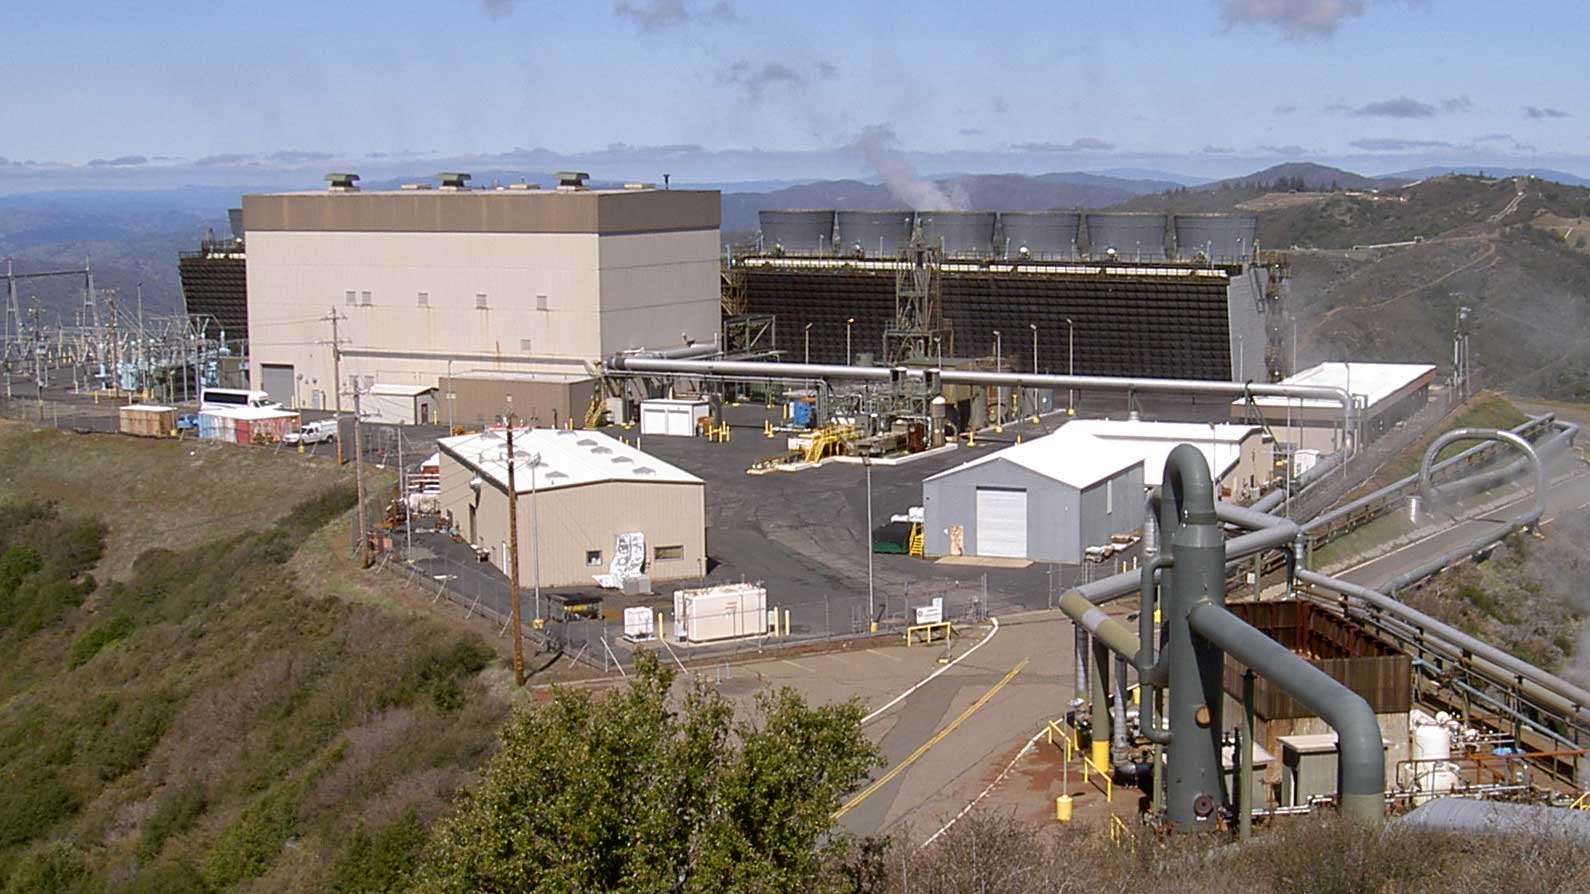
Largest Geothermal Power Plant in the World
The world's largest geothermal field is the Geysers Geothermal Complex located in Northern California, just 72 miles north of San Francico in the Mayacamas Mountains.
The Geysers complex covers an area about 87 km^2 (30 miles^2) and consists of 22 geothermal power stations that draw steam from more than 350 wells. The total power capacity of the Geysers is 1517 MW and is by far the largest geothermal energy field in the world (the second largest is Mexico's Cerro Prieto Geothermal Power Stations, which has an installed capacity of 820 MW). At full capacity, the Geysers produces enough electricity to power around 1,000,000 homes.
References
Hydropower
Hydropower is the largest source of renewable energy in the world. Hydropower stations, the majority of which are dams, are among the largest electricity generating facilities in the world in terms of total capacity. In 2016, hydropower contributed to 54.3% of all renewable electricity generated.
Hydropower is also the most commonly adopted form of renewable energy. More than 150 countries, including many less developed countries, use some form of hydropower. In contrast, adoption of other renewable energy sources like solar, wind, and geothermal is still limited to a few countries.
Outlook
Although hydropower is globally the largest source of renewable energy, it is not growing as fast as other renewable energy sources like solar and wind. In 2016, hydropower capacity grew by 25 GW for a total of 1,096 GW, an increase of just 2.33%. In comparison, solar power capacity grew by 75 GW for a total of 303 GW, an increase of 32.89%. Wind power capacity grew by 54 GW for a total of 487 GW, an increase of 12.47%.
There are at least three reasons why hydropower will not be the main driver of renewable growth in the near future.
One, hydropower is growing from a larger and more developed base. Compared to other sources of renewable energy, many of its low hanging fruits have already been picked. Nonetheless, it's estimated that only about 1/4 of the world's hydropower potential has been developed, so there is still room for further growth.
Two, there is growing concern around the negative social and environmental impacts of developing hydropower. Large dams in particular can alter human and natural landscapes in a profound way. For example, the construction of the Three Gorges Dam, the largest dam in the world, displaced 1.3 million people, flooded archaelogical and cultural sites, and disrupted the habitats of endangered species like the Baiji Dolphin.
Three, as the technology around solar power and wind power continues to improve, both solar power and wind power offers a cost competitive and more flexible solution for renewable energy. In addition, both solar power and wind power facilities have a smaller ecological impact than hydropower sources like dams.
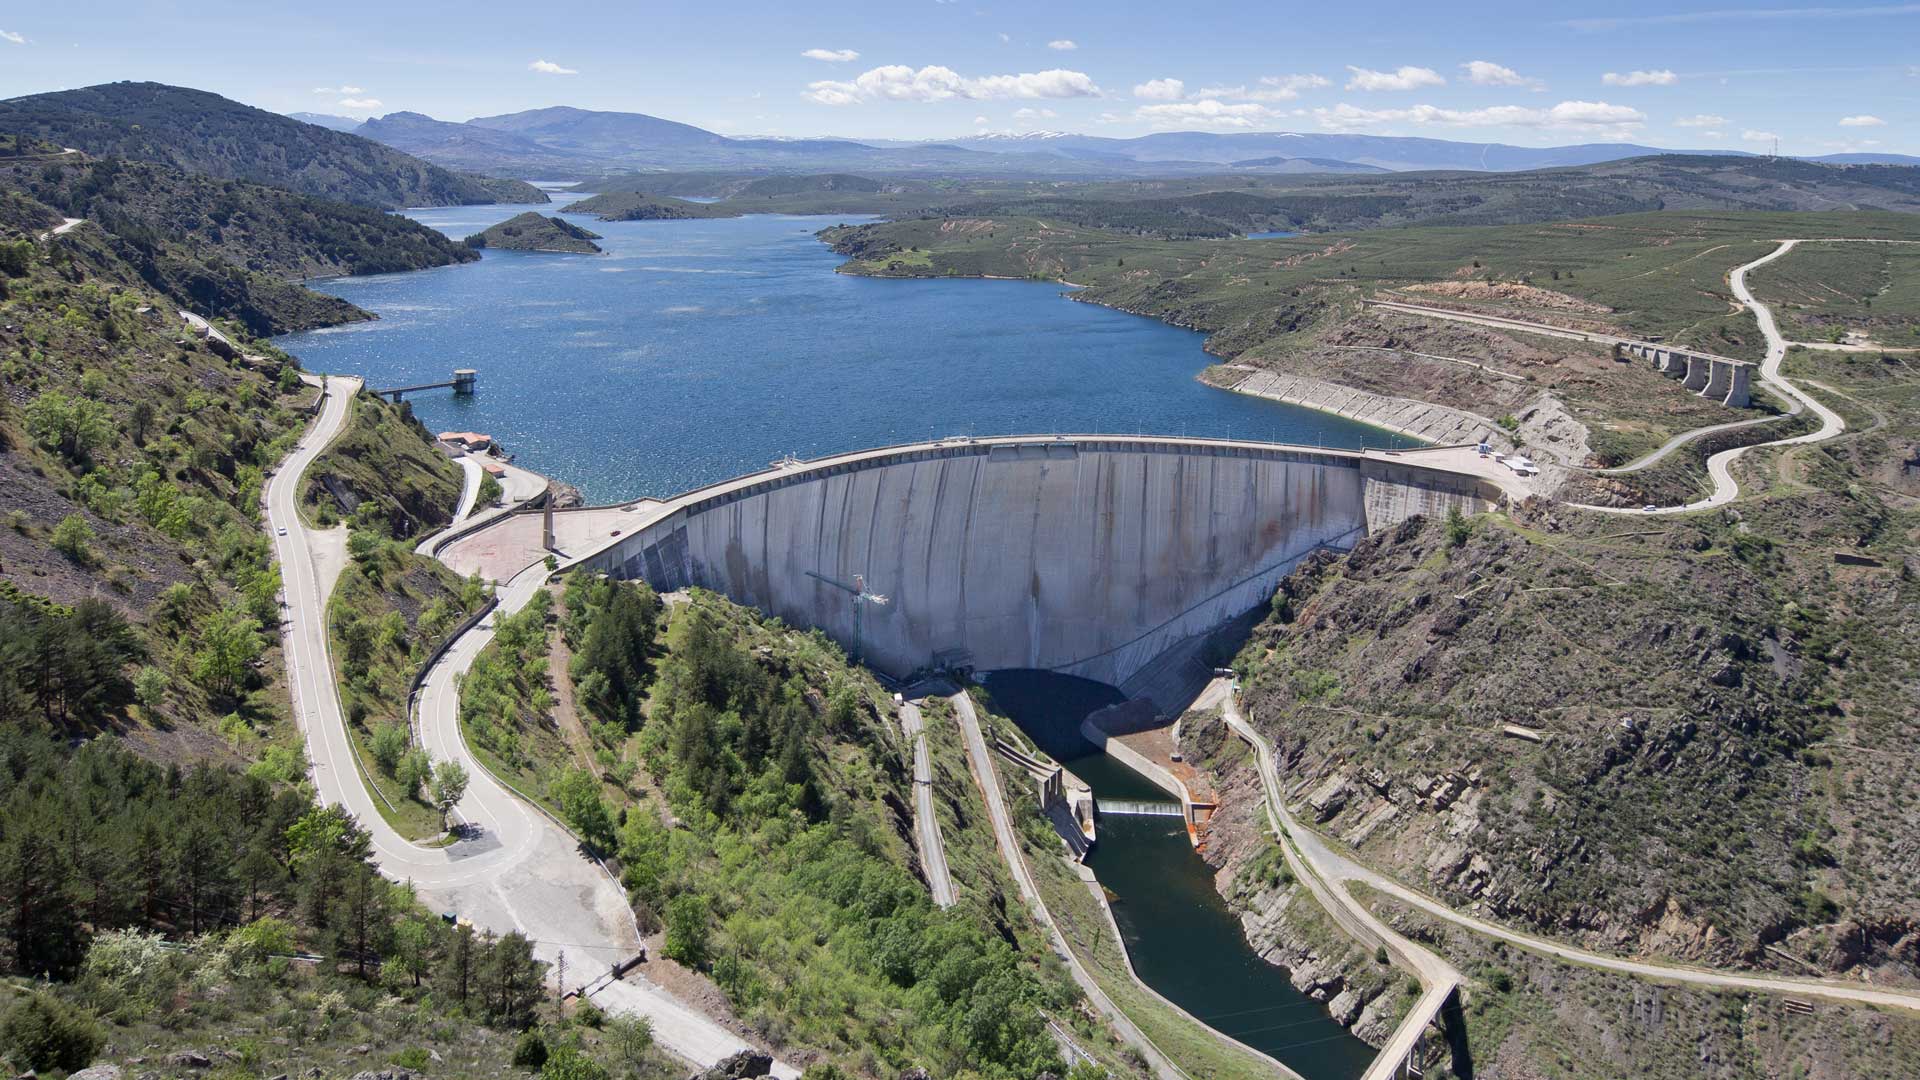
Despite these challenges, companies and governments around the world are still making investments to better harness the power of the world's water. In highly developed countries where opinions on large dams have soured, new hydropower facilities take on smaller forms like run-of-the-river hydroelectricity, which generate electricity without creating large reservoirs. Furthermore, the technology around dams have not stagnated and continue to improve so that existing dams can be upgraded to become more efficient.
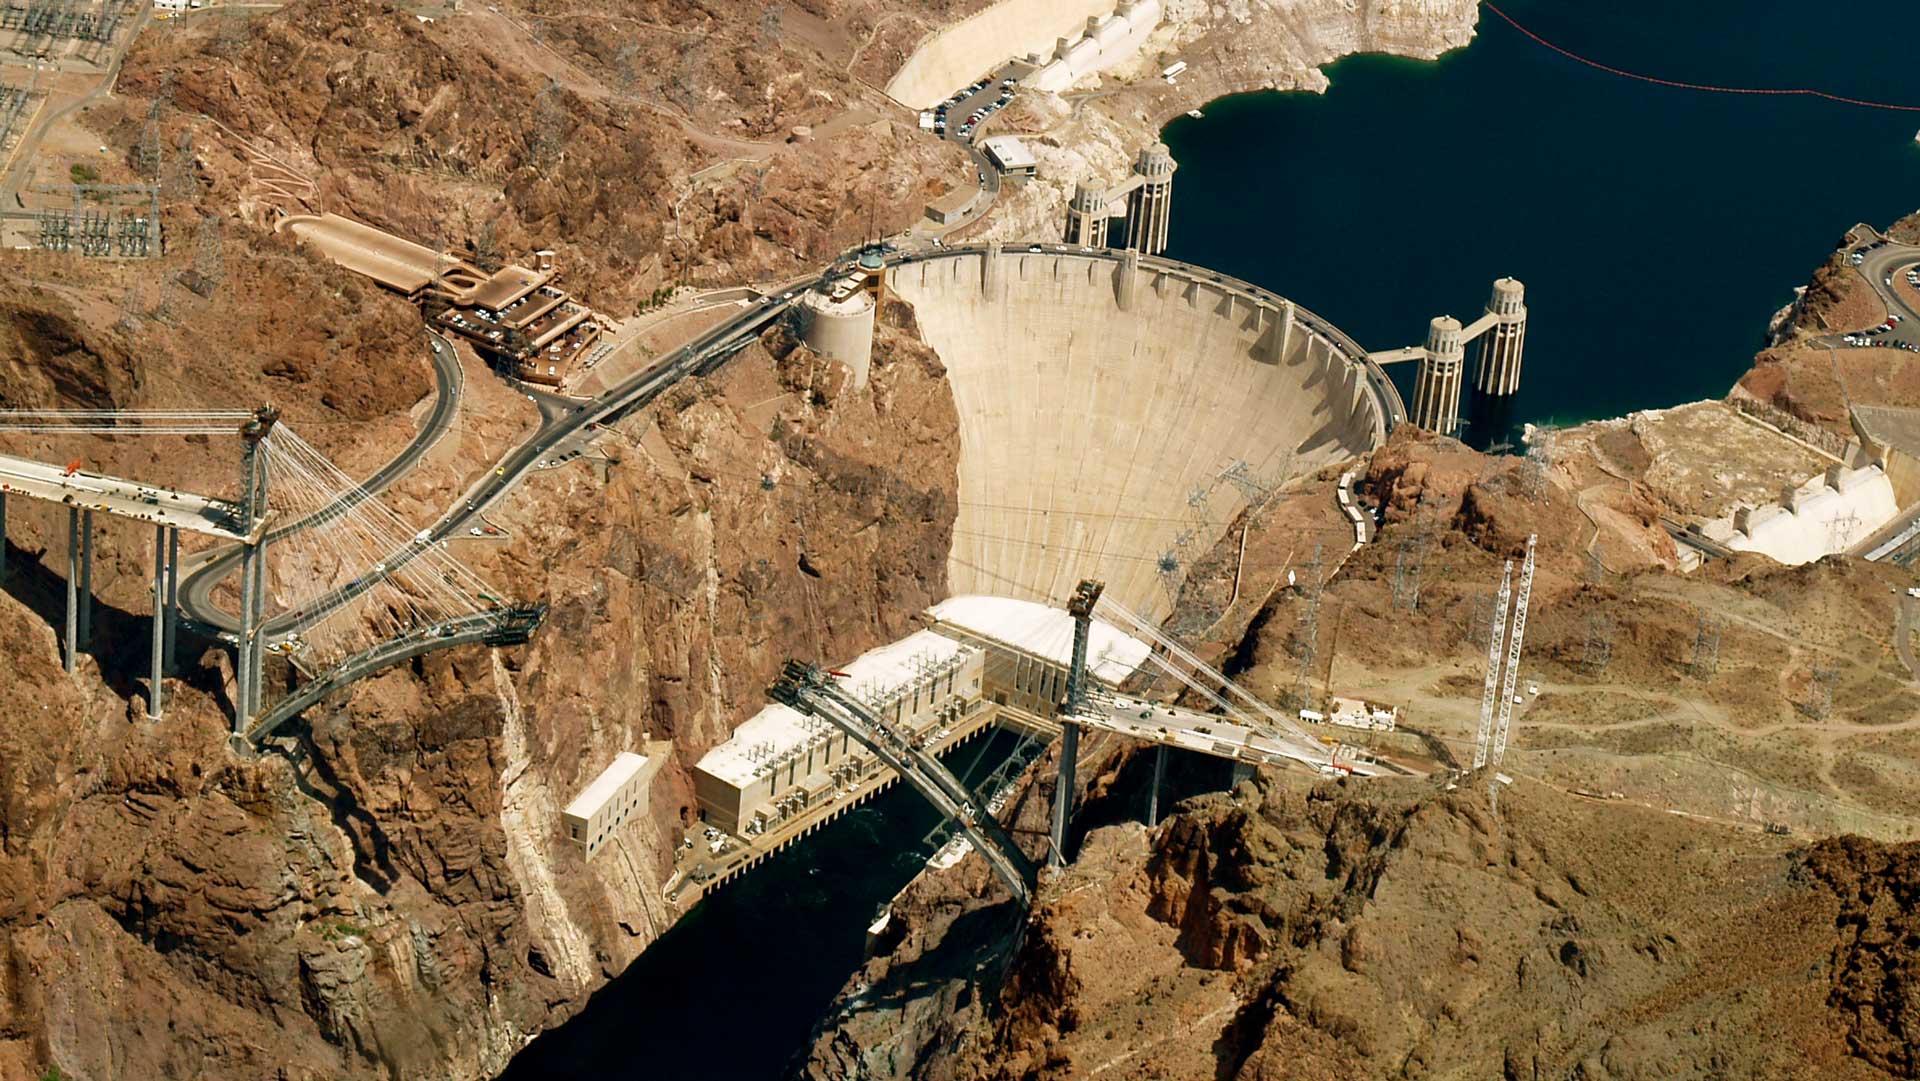
Largest Hydropower Station in the World
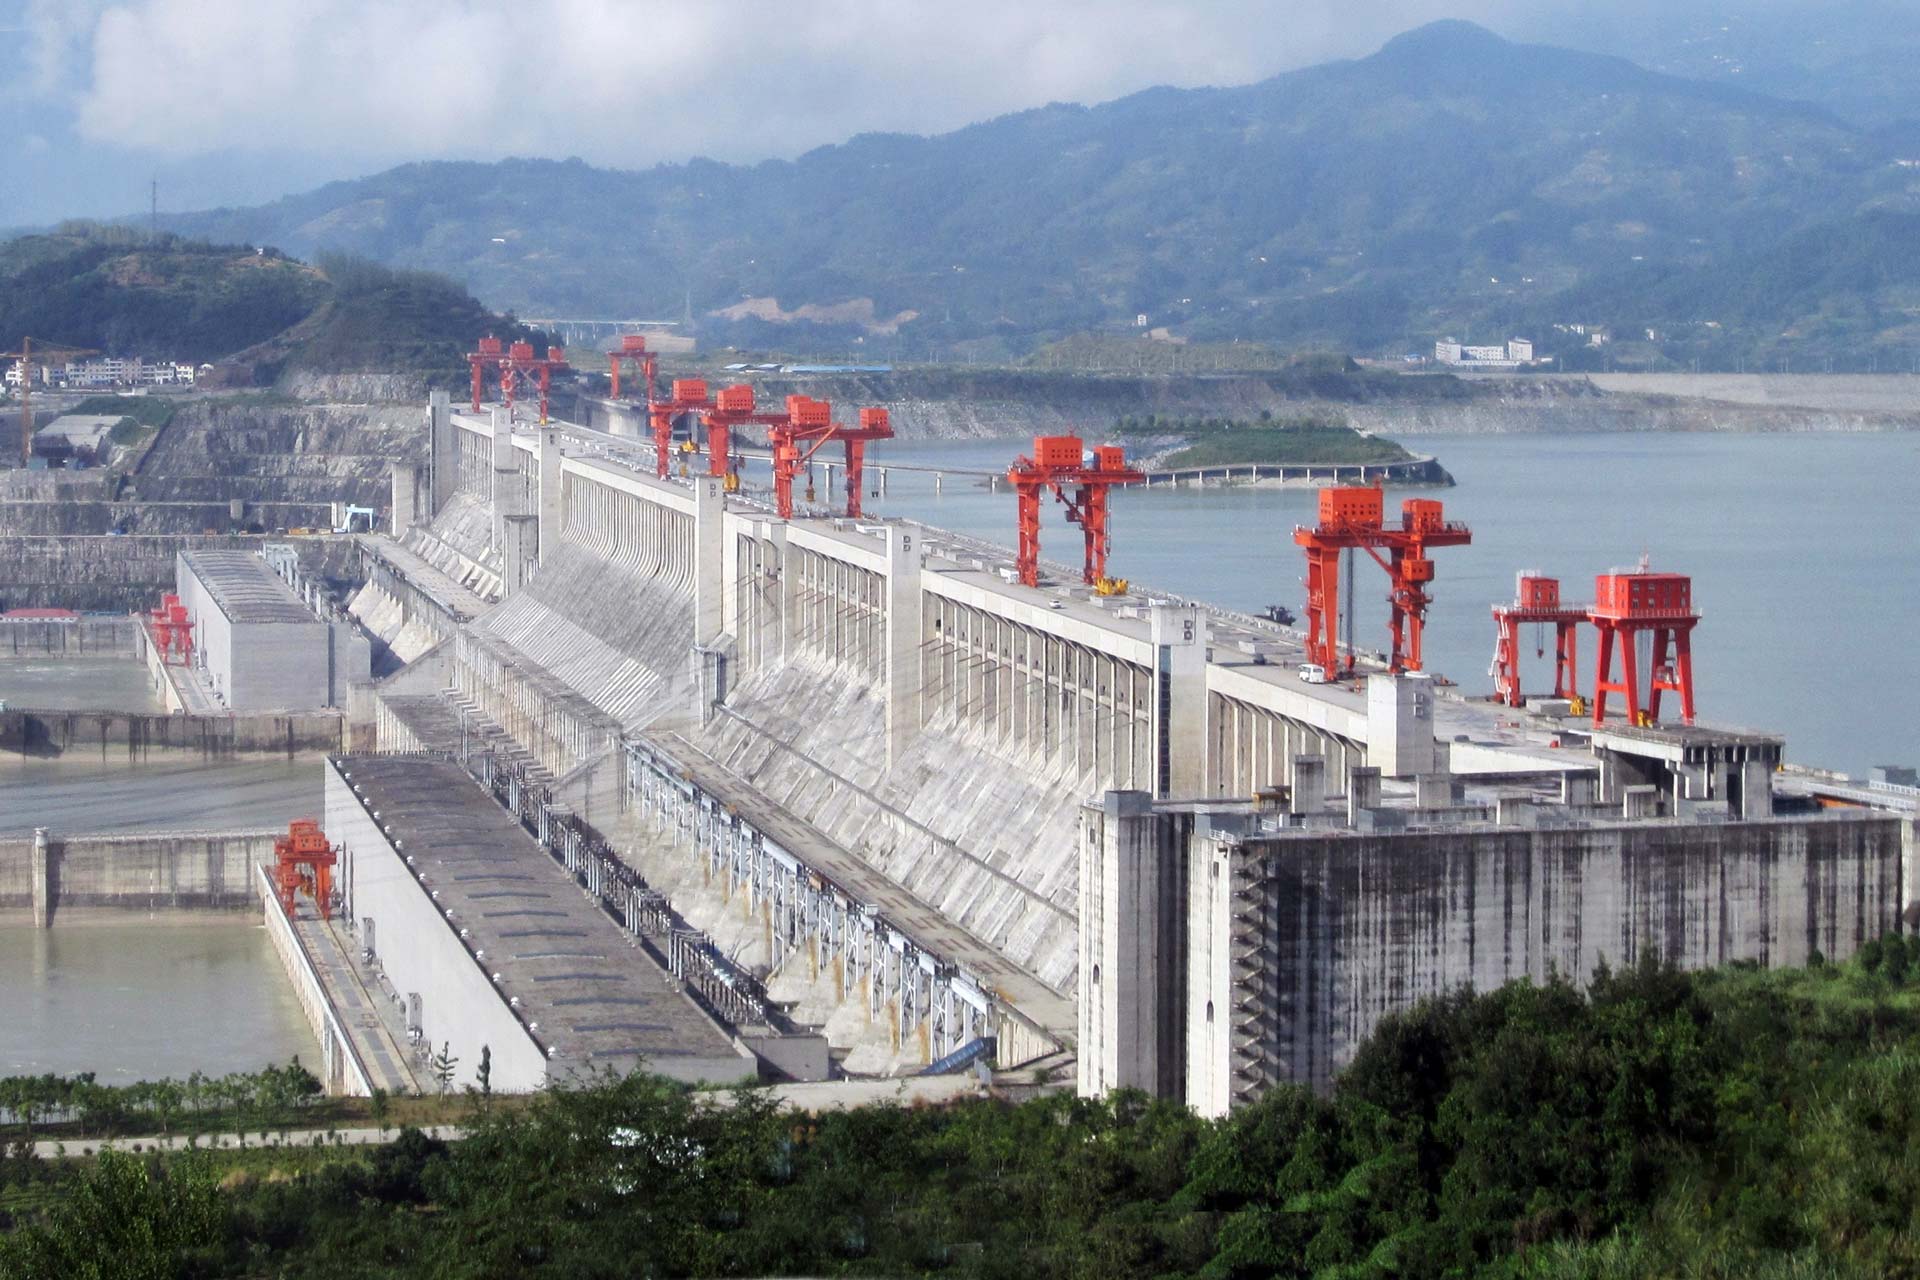
The world's largest hydropower station is the Three Gorges Dam in Central China. The massive dam has a total electricity generating capacity of 22,500 MW, twenty times more than Hoover Dam. That means the Three Gorges Dam can generate enough electricity to power approximately 15,000,000 homes.
The Three Gorges Dam also happens to be not only the largest hydrostation but also the largest power producing facility of any kind in the world. And it's not even close. The next largest power facility in the world is the Itaipu Dam, which only has a total capacity of 14,000 MW, around 50% less than the Three Gorges Dam.
Further Reading
Methodology
We calculate the "total" renewable energy capacity for each country by adding each country's energy capacity for solar, wind, geothermal, and hydro. This excludes energy production from other renewable energy sources like biomass/waste and wave/tidal. The sources for the collected data come from several different organizations and the year for which the data represents are not consistent with each other (e.g. the solar power data comes from 2016 but the hydropower data comes from 2017). So the numbers presented in this visualization are only meant to be generally interpreted.