Solar power (aka photovoltaic energy) is booming. As of 2016, solar power only contributed to around 1% of total worldwide electricty production but is growing at a rapid rate of 33% per year. The rapid rise of solar power in recent years can be attributed to at least a few factors.
One, photovoltaic cells are cheaper and more efficient than ever. In 1975, solar power cost nearly $100 per watt. In 2015, the price per watt has decreased to just 61 cents, a decrease of over 99%.
Two, as renewable energy sources like solar power become more economical, people will tolerate less and less the pollution and global warming caused by burning nonrenewable fuel like oil and coal.
Three, events like the Three Mile Island accident and the Fukushima Daiichi nuclear disaster have convinced many people that nuclear power is unsafe. For example, following the Fukushima Daiichu nuclear disaster, Germany declared that it would shut down all 17 of its nuclear power stations by 2022.
These three factors have all contributed to the rapid rise of solar power around the world. In this post, we want to show you which countries are leading the way in terms of total solar power production and which countries are still lagging behind.
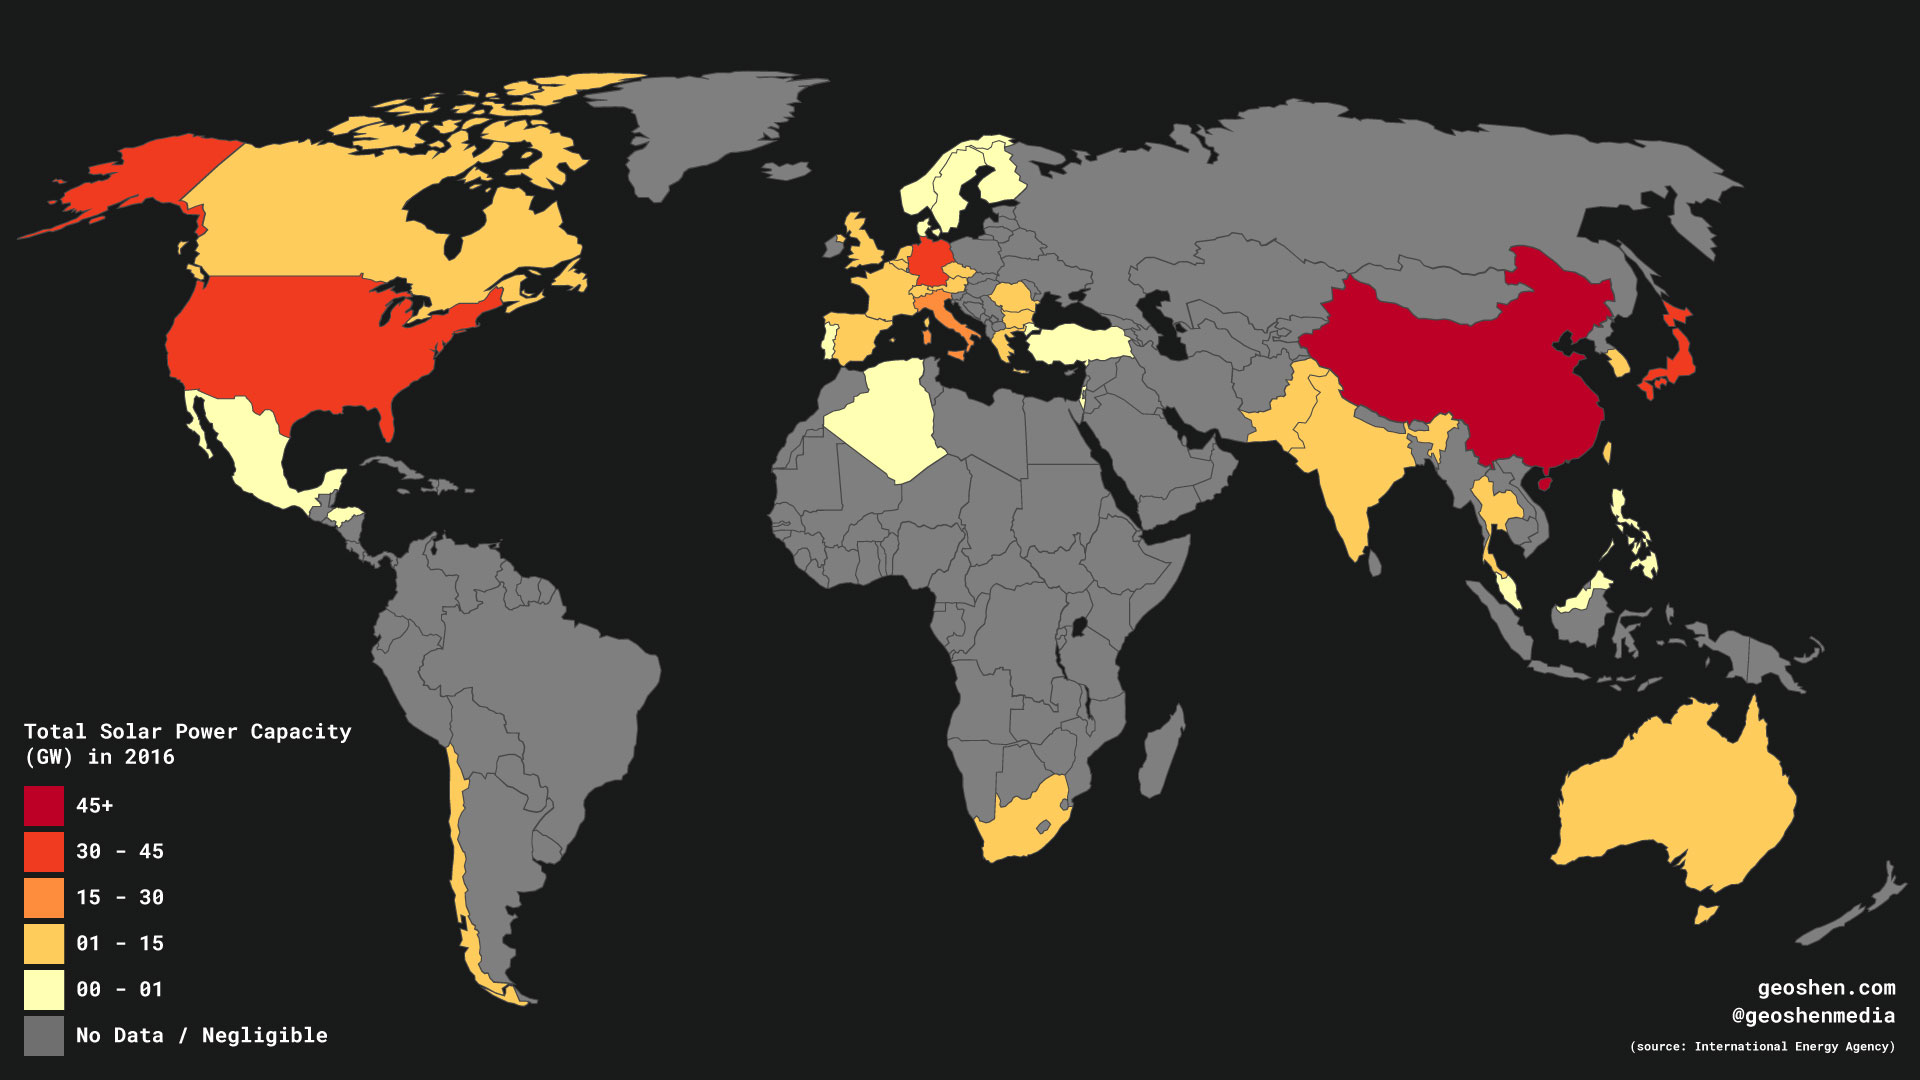
Map of total solar power capacity around the world
In terms of total solar power capacity, China leads the world. In 2016 alone, China added 34.54 GW of PV capacity. That's more than what all other countries combined had installed in the same year. Then in 2017, China outdid themselves and added another whopping 52.83 GW worth of solar power. In a single year China managed to install more solar power than 2nd place Japan has in total (42.75 GW).
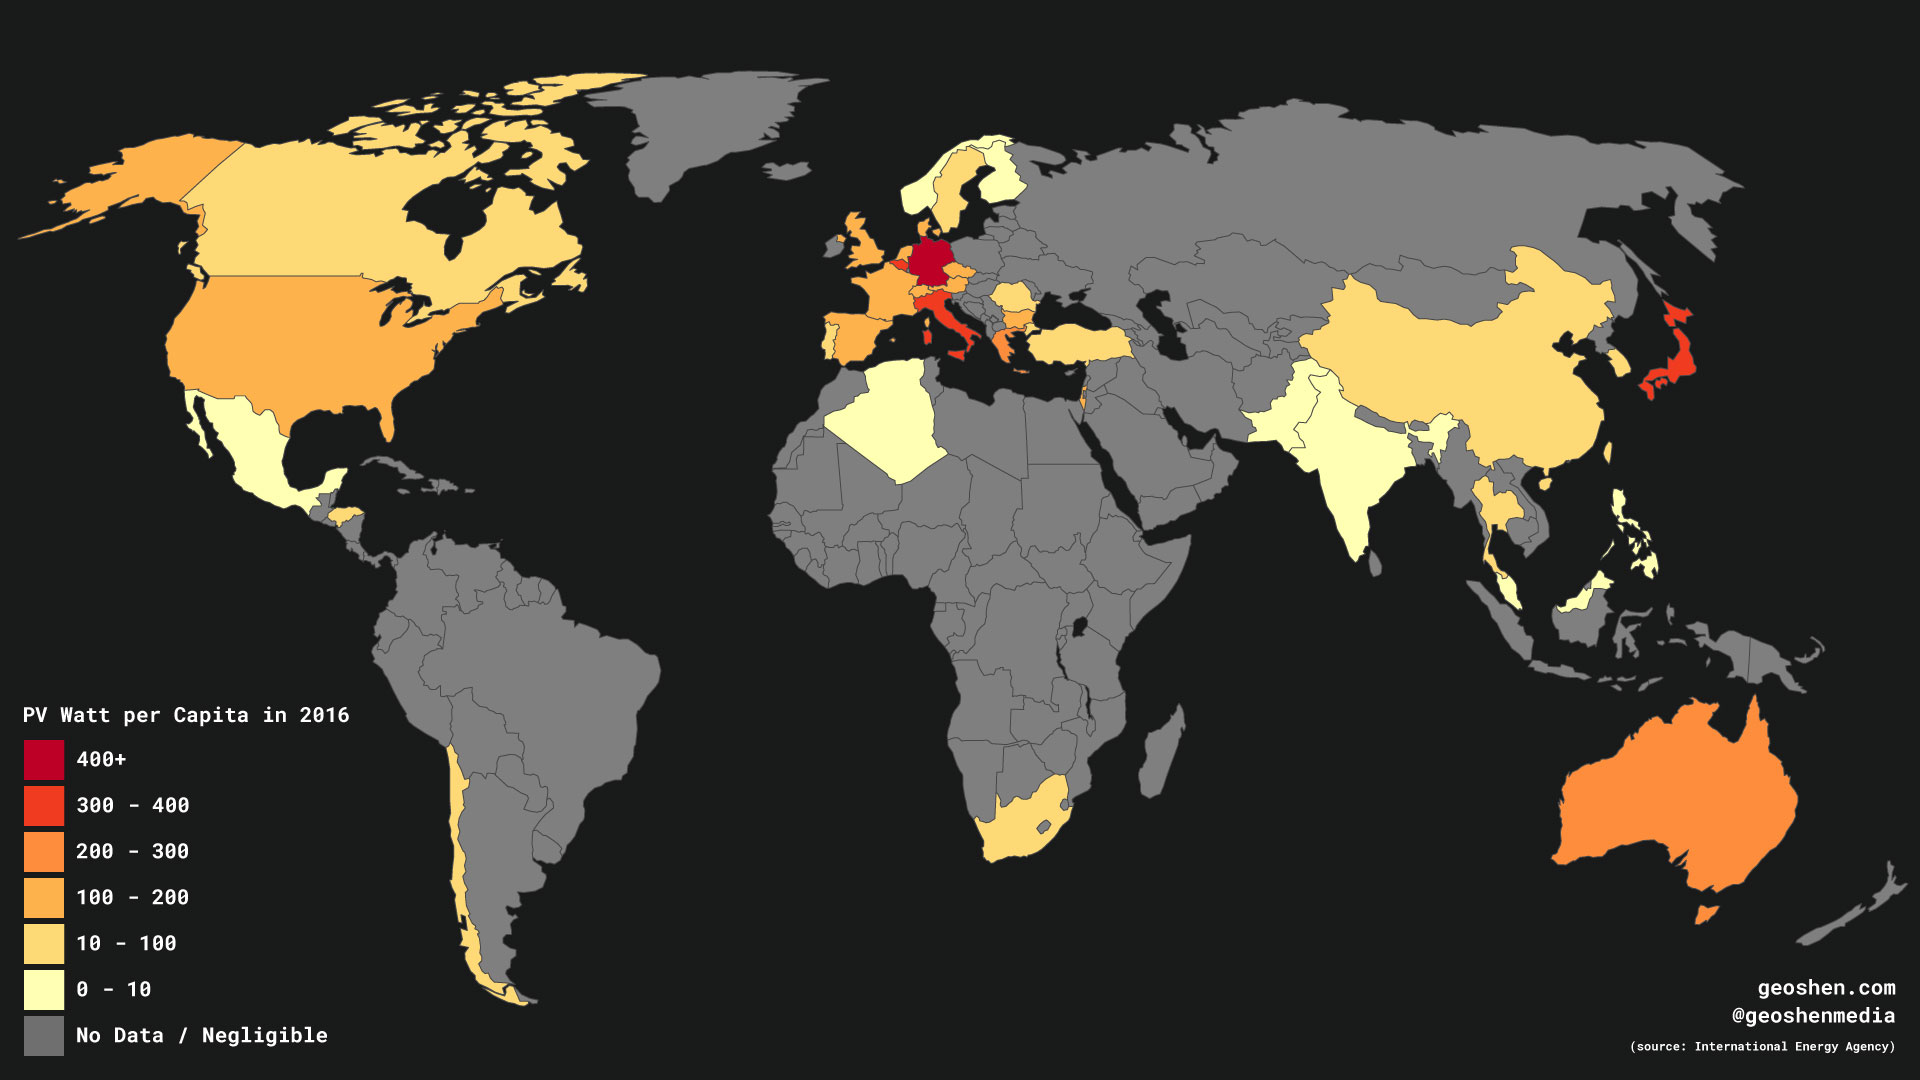
Map of Photovoltaic Watt per capita in 2016
Despite China's incredible PV solar growth in the last few years, their PV Watt per capita is still low, given its large population, when compared to many other countries. Germany, Japan, and Italy are the world's leaders in terms of solar power capacity installed per person.
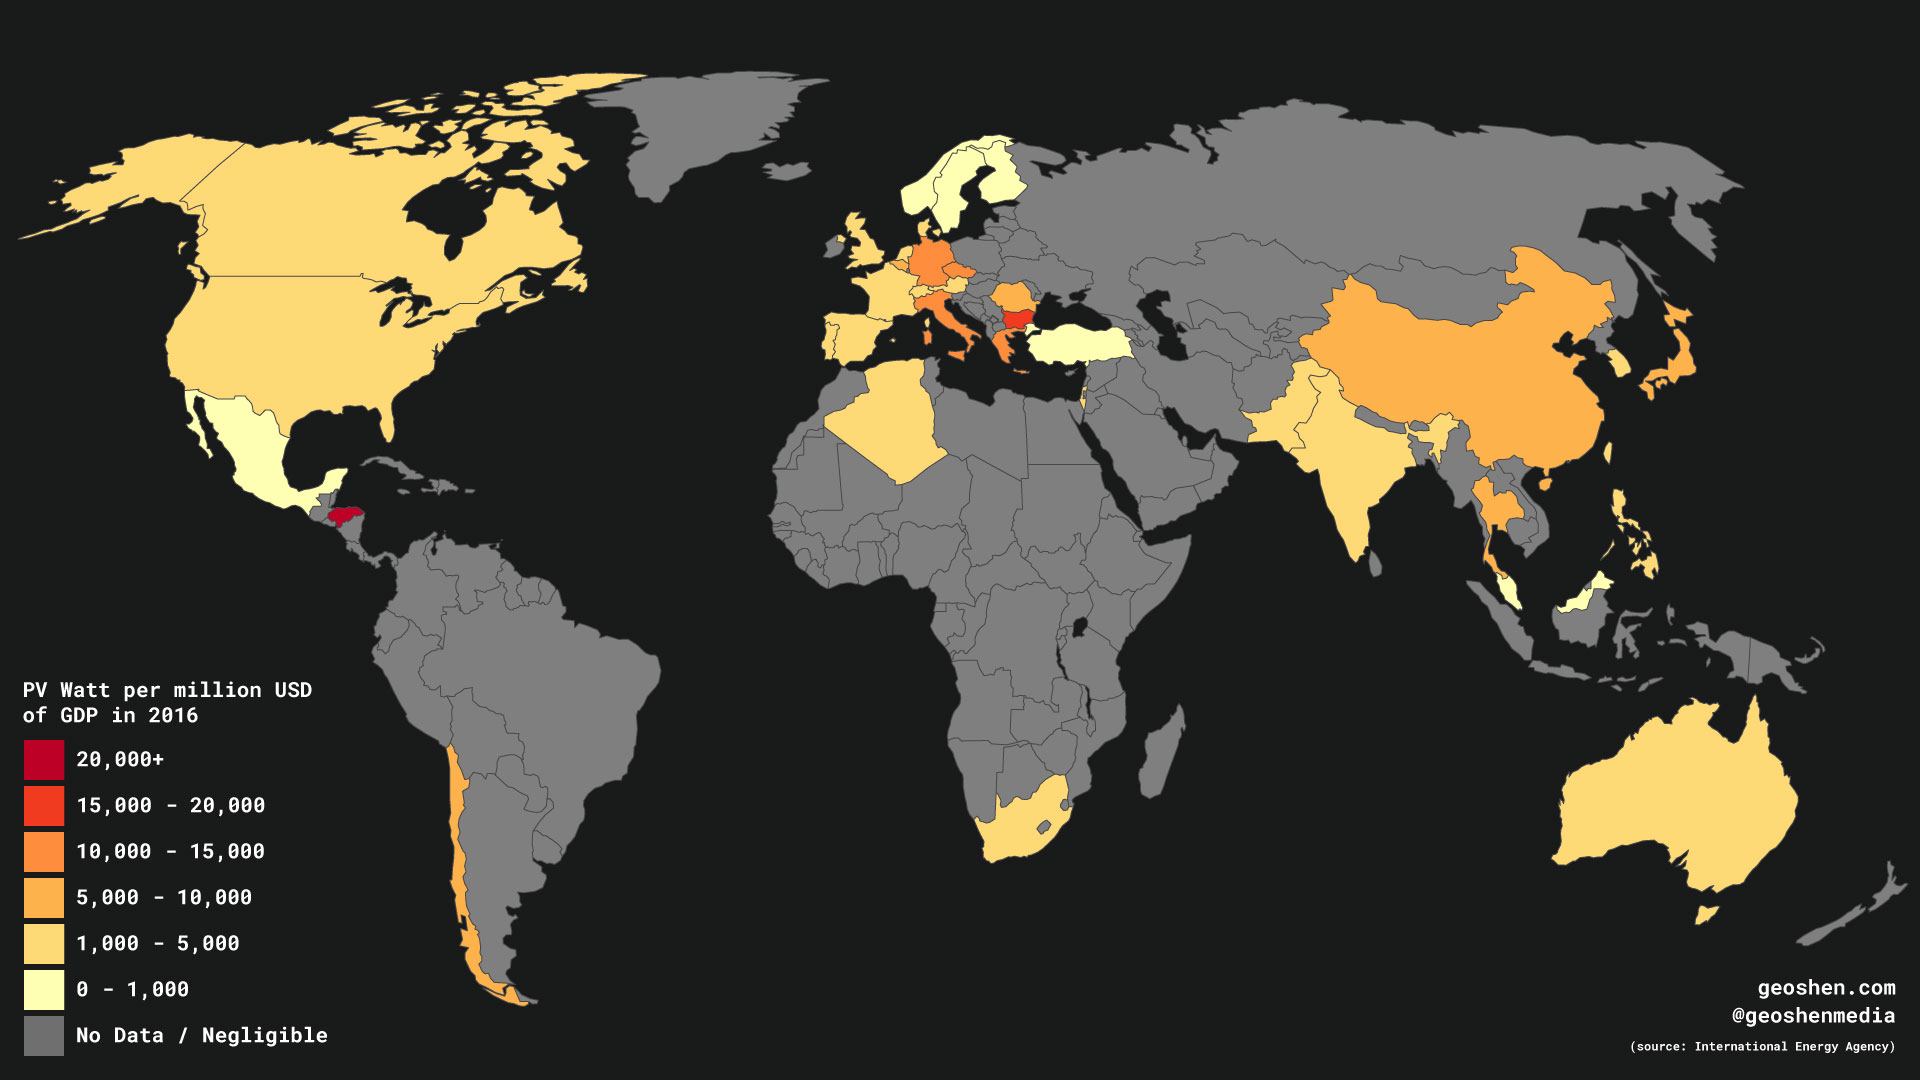
Map of Photovoltaic Watt per million USD of GDP in 2016
Relative to the size of its economy, it's little Honduras in Central America that punches above its weight and leads the world in total solar capacity. Honduras has the world's highest PV power penetration, and it's estimated that 12% of the country's total electricity comes from solar power.
Installed PV Solar Power (2016)
| Rank | Nation | Abbreviation | Total Capacity (GW) | Population | PV Watt per Capita | GDP (millions) | PV Watt per GDP (millions) |
| 1 | China | CN | 78.07 | 1,403,500,365.00 | 55.63 | 11,218,281 | 6,959.18 |
| 2 | Japan | JP | 42.75 | 127,748,513.00 | 334.64 | 4,936,211 | 8,660.49 |
| 3 | Germany | DE | 41.22 | 81,914,672.00 | 503.21 | 3,477,796 | 11,852.33 |
| 4 | United States | US | 40.3 | 322,179,605.00 | 125.09 | 18,624,475 | 2,163.82 |
| 5 | Italy | IT | 19.28 | 59,429,938.00 | 324.42 | 1,858,913 | 10,371.65 |
| 6 | United Kingdom | GB | 11.63 | 65,788,574.00 | 176.78 | 2,647,898 | 4,392.16 |
| 7 | India | IN | 9.01 | 1,324,171,354.00 | 6.8 | 2,259,642 | 3,987.36 |
| 8 | France | FR | 7.13 | 64,720,690.00 | 110.17 | 2,465,453 | 2,891.96 |
| 9 | Australia | AU | 5.9 | 24,125,848.00 | 244.55 | 1,304,463 | 4,522.93 |
| 10 | Spain | ES | 5.49 | 46,347,576.00 | 118.45 | 1,237,255 | 4,437.24 |
| 11 | South Korea | KR | 4.35 | 50,791,919.00 | 85.64 | 1,411,245 | 3,082.38 |
| 12 | Belgium | BE | 3.42 | 11,358,379.00 | 301.1 | 467,955 | 7,308.40 |
| 13 | Canada | CA | 2.72 | 36,289,822.00 | 74.95 | 1,529,760 | 1,778.06 |
| 14 | Greece | GR | 2.6 | 11,183,716.00 | 232.48 | 235,574 | 11,036.87 |
| 15 | Thailand | TH | 2.15 | 68,863,514.00 | 31.22 | 407,026 | 5,282.22 |
| 16 | Czech Republic | CZ | 2.1 | 10,610,947.00 | 197.91 | 205,270 | 10,230.43 |
| 17 | Netherlands | NL | 2.1 | 16,987,330.00 | 123.62 | 777,227 | 2,701.91 |
| 18 | Switzerland | CH | 1.64 | 8,401,739.00 | 195.2 | 668,851 | 2,451.97 |
| 19 | Chile | CL | 1.61 | 17,909,754.00 | 89.9 | 258,062 | 6,238.81 |
| 20 | South Africa | ZA | 1.45 | 56,015,473.00 | 25.89 | 349,819 | 4,145.00 |
| 21 | Taiwan | TW | 1.38 | 23,556,706.00 | 58.58 | 571,453 | 2,414.90 |
| 22 | Romania | RO | 1.3 | 19,778,083.00 | 65.73 | 199,045 | 6,531.19 |
| 23 | Austria | AT | 1.08 | 8,712,137.00 | 123.96 | 390,799 | 2,763.57 |
| 24 | Bulgaria | BG | 1 | 7,131,494.00 | 140.22 | 56,718 | 17,631.09 |
| 25 | Pakistan | PK | 1 | 193,203,476.00 | 5.18 | 251,255 | 3,980.02 |
| 26 | Israel | IL | 0.91 | 8,191,828.00 | 111.09 | 305,673 | 2,977.04 |
| 27 | Philippines | PH | 0.9 | 103,320,222.00 | 8.71 | 290,896 | 3,093.89 |
| 28 | Denmark | DK | 0.9 | 5,711,870.00 | 157.57 | 346,119 | 2,600.26 |
| 29 | Turkey | TR | 0.83 | 79,512,426.00 | 10.44 | 863,711 | 960.97 |
| 30 | Portugal | PT | 0.51 | 10,371,627.00 | 49.17 | 230,117 | 2,216.26 |
| 31 | Honduras | HN | 0.39 | 9,112,867.00 | 42.8 | 19,497 | 20,003.08 |
| 32 | Algeria | DZ | 0.35 | 40,606,052.00 | 8.62 | 213,518 | 1,639.21 |
| 33 | Mexico | MX | 0.32 | 127,540,423.00 | 2.51 | 1,076,914 | 297.15 |
| 34 | Malaysia | MY | 0.29 | 31,187,265.00 | 9.3 | 326,933 | 887.03 |
| 35 | Sweden | SE | 0.18 | 9,837,533.00 | 18.3 | 514,475 | 349.87 |
| 36 | Norway | NO | 0.027 | 5,254,694.00 | 5.14 | 371,068 | 72.76 |
| 37 | Finland | FI | 0.015 | 5,503,132.00 | 2.73 | 272,217 | 55.10 |
Conclusion
Solar power prices have fallen low enough that it has become cost competitive with fossil fuels and will likely become cheaper in the future as solar PV tech continues to improve. Many countries, such as China, Germany, and Japan, have already ramped up their investments in solar power because it offers a safer, cleaner, and cheaper source of energy than fossil fuels and nuclear power. But despite solar power's rapid growth in the last decade, solar power remains underdeveloped in even the biggest solar markets. Furthermore, the majority of countries in the world still do not have any significant solar power capacity. Solar power remains limited to only the most advanced or wealthiest nations (with some exceptions like Honduras).