Introduction
China overtook the US to become the world's largest exporter of goods in 2009 and has maintained its lead ever since. In both 2016 and 2017, China exported over 2 trillion dollars worth of goods, mainly to the United States. But which provinces in China exports the most and which exports the least in terms of USD value? In this post, we'll answer that question by looking at the total export value of every Chinese province and then provide some analysis on their meaning.
Map of every Chinese province and their total export value
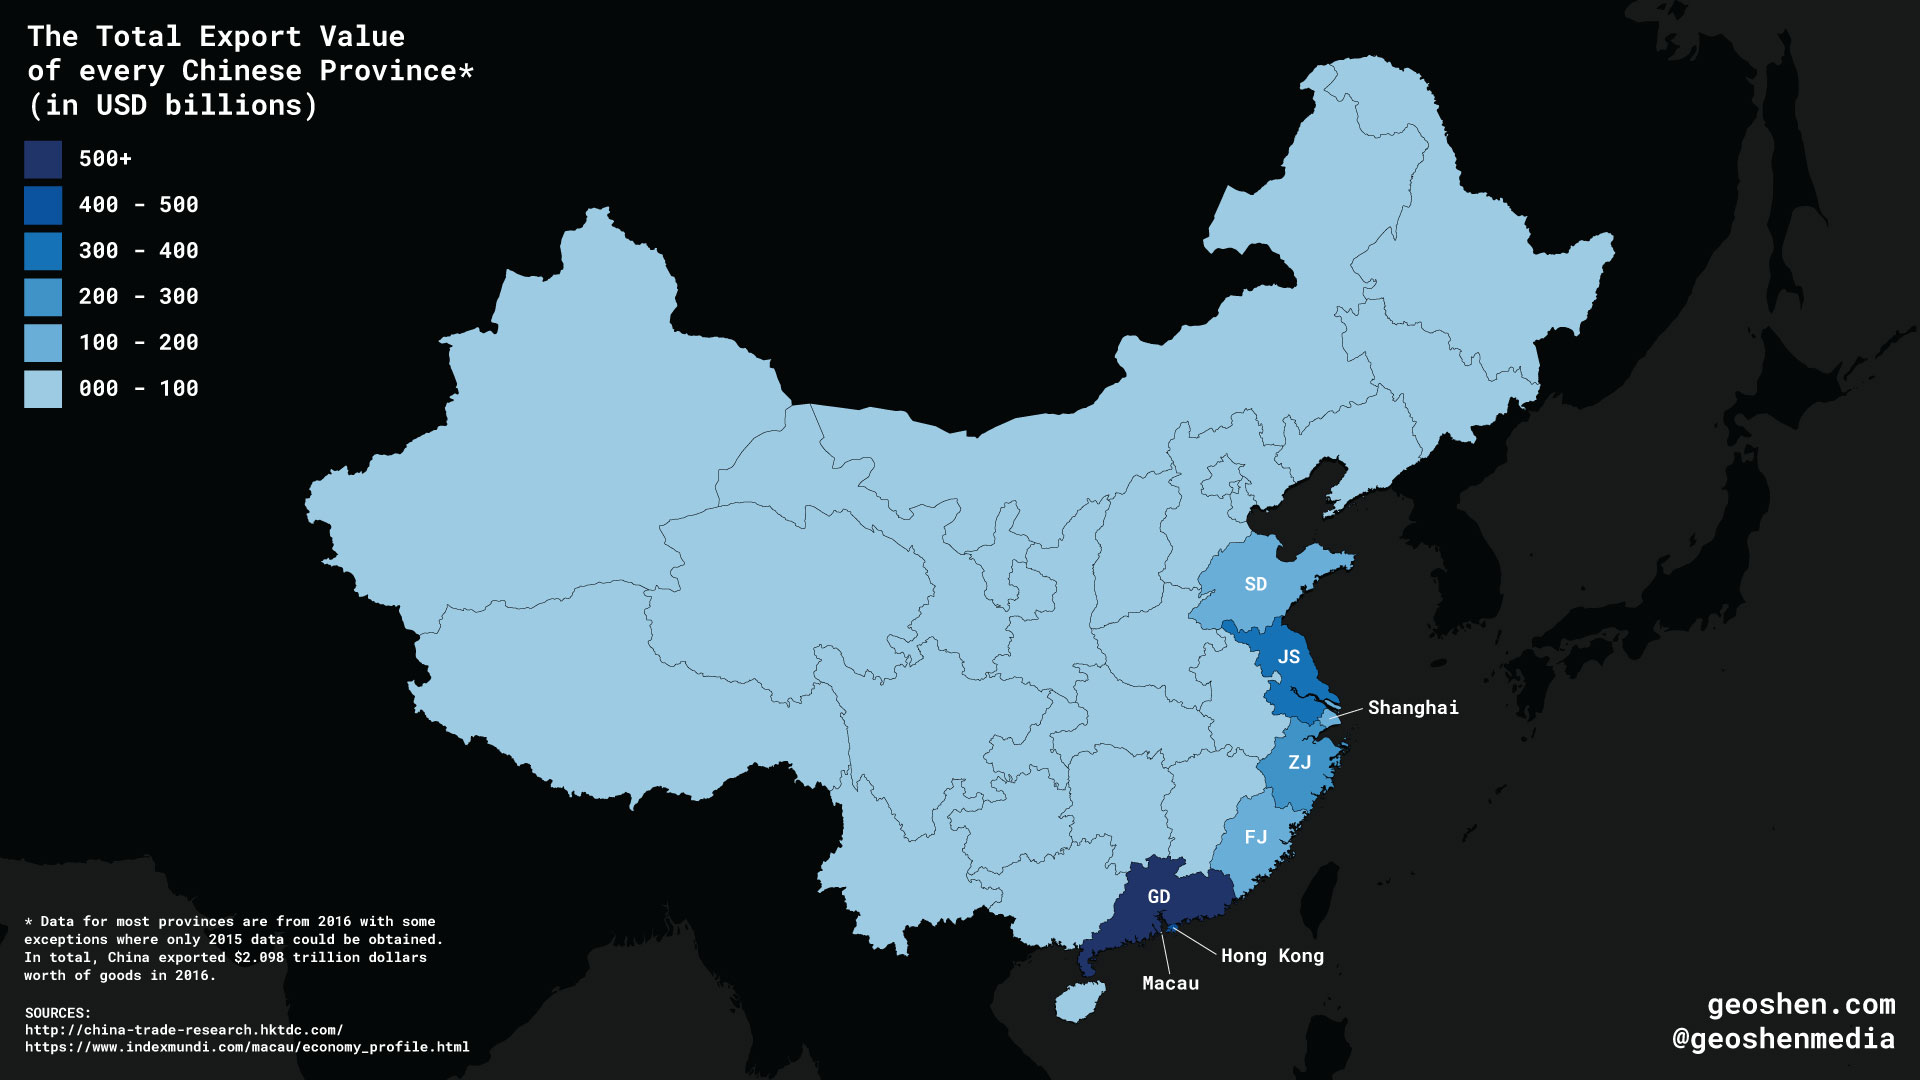
Table for the total export value of every Chinese Province (USD billions)
The below table shows export data from every Chinese province. Most of the data comes from 2016 with some exceptions where the latest data could only be obtained from 2015. In total, China exported $2.098 trillion dollars worth of goods in 2016. This total export value for China does not include exports from Special Administrative Regions (SAR) like Hong Kong and Macau (which are highlighted in the table below).
| Rank | abbreviation | name | export value | year | GDP | percent of GDP | administrative division type |
| 1 | GD | Guangdong | 598.9 | 2016 | 1,217.27 | 49.2 | province |
| 2 | HK | Hong Kong | 459.4 | 2016 | 320.9 | 143.16 | special administrative region (SAR) |
| 3 | JS | Jiangsu | 319.3 | 2016 | 1,165.08 | 27.41 | province |
| 4 | ZJ | Zhejiang | 267.9 | 2016 | 711.37 | 37.66 | province |
| 5 | SH | Shanghai | 183.5 | 2016 | 424.23 | 43.25 | municipality |
| 6 | SD | Shandong | 144.1 | 2015 | 1,024.11 | 14.07 | province |
| 7 | FJ | Fujian | 103.7 | 2016 | 433.74 | 23.91 | province |
| 8 | BJ | Beijing | 51.8 | 2016 | 386.45 | 13.4 | municipality |
| 9 | TJ | Tianjin | 51.2 | 2015 | 269.27 | 19.01 | municipality |
| 10 | LN | Liaoning | 50.7 | 2015 | 334.93 | 15.14 | province |
| 11 | HA (HEN) | Henan | 42.8 | 2016 | 609.3 | 7.02 | province |
| 12 | CQ | Chongqing | 40.7 | 2016 | 267.09 | 15.24 | municipality |
| 13 | HE (HEB) | Hebei | 32.9 | 2015 | 482.82 | 6.81 | province |
| 14 | JX | Jiangxi | 29.8 | 2016 | 278.5 | 10.7 | province |
| 15 | HB (HUB) | Hubei | 29.2 | 2015 | 491.78 | 5.94 | province |
| 16 | AH | Anhui | 28.4 | 2016 | 367.46 | 7.73 | province |
| 17 | SC | Sichuan | 26.2 | 2016 | 495.83 | 5.28 | province |
| 18 | GX | Guangxi | 22.957 | 2016 | 275.77 | 8.32 | autonomous region |
| 19 | HN (HUN) | Hunan | 19.1 | 2015 | 475.01 | 4.02 | province |
| 20 | XJ | Xinjiang | 15.607 | 2016 | 145.28 | 10.74 | autonomous region |
| 21 | SN (SAA) | Shaanxi | 14.8 | 2015 | 292.06 | 5.07 | province |
| 22 | YN | Yunnan | 11.483 | 2016 | 222.64 | 5.16 | province |
| 23 | SX (SAX) | Shanxi | 9.9 | 2016 | 196.47 | 5.04 | province |
| 24 | HL | Heilongjiang | 5.044 | 2016 | 231.64 | 2.18 | province |
| 25 | GZ | Guizhou | 4.736 | 2016 | 177.3 | 2.67 | province |
| 26 | JL | Jilin | 4.7 | 2015 | 222.47 | 2.11 | province |
| 27 | NM | Inner Mongolia | 4.374 | 2016 | 272.92 | 1.6 | autonomous region |
| 28 | GS | Gansu | 4.088 | 2016 | 108.4 | 3.77 | province |
| 29 | NX | Ningxia | 2.497 | 2016 | 47.7 | 5.23 | autonomous region |
| 30 | HI | Hainan | 2.122 | 2016 | 61.02 | 3.48 | province |
| 31 | MO | Macau | 1.959 | 2015 | 44.8 | 4.37 | special administrative region (SAR) |
| 32 | QH | Qinghai | 1.3,661 | 2016 | 38.73 | 3.53 | province |
| 33 | XZ | Tibet | 0.472 | 2016 | 17.34 | 2.72 | autonomous region |
Some Takeaways
Provinces along the eastern and southern coast export the most. They are ranked in order: Guangdong, Hong Kong, Jiangsu, Zhejiang, Shanghai, Shandong, and Fujian.
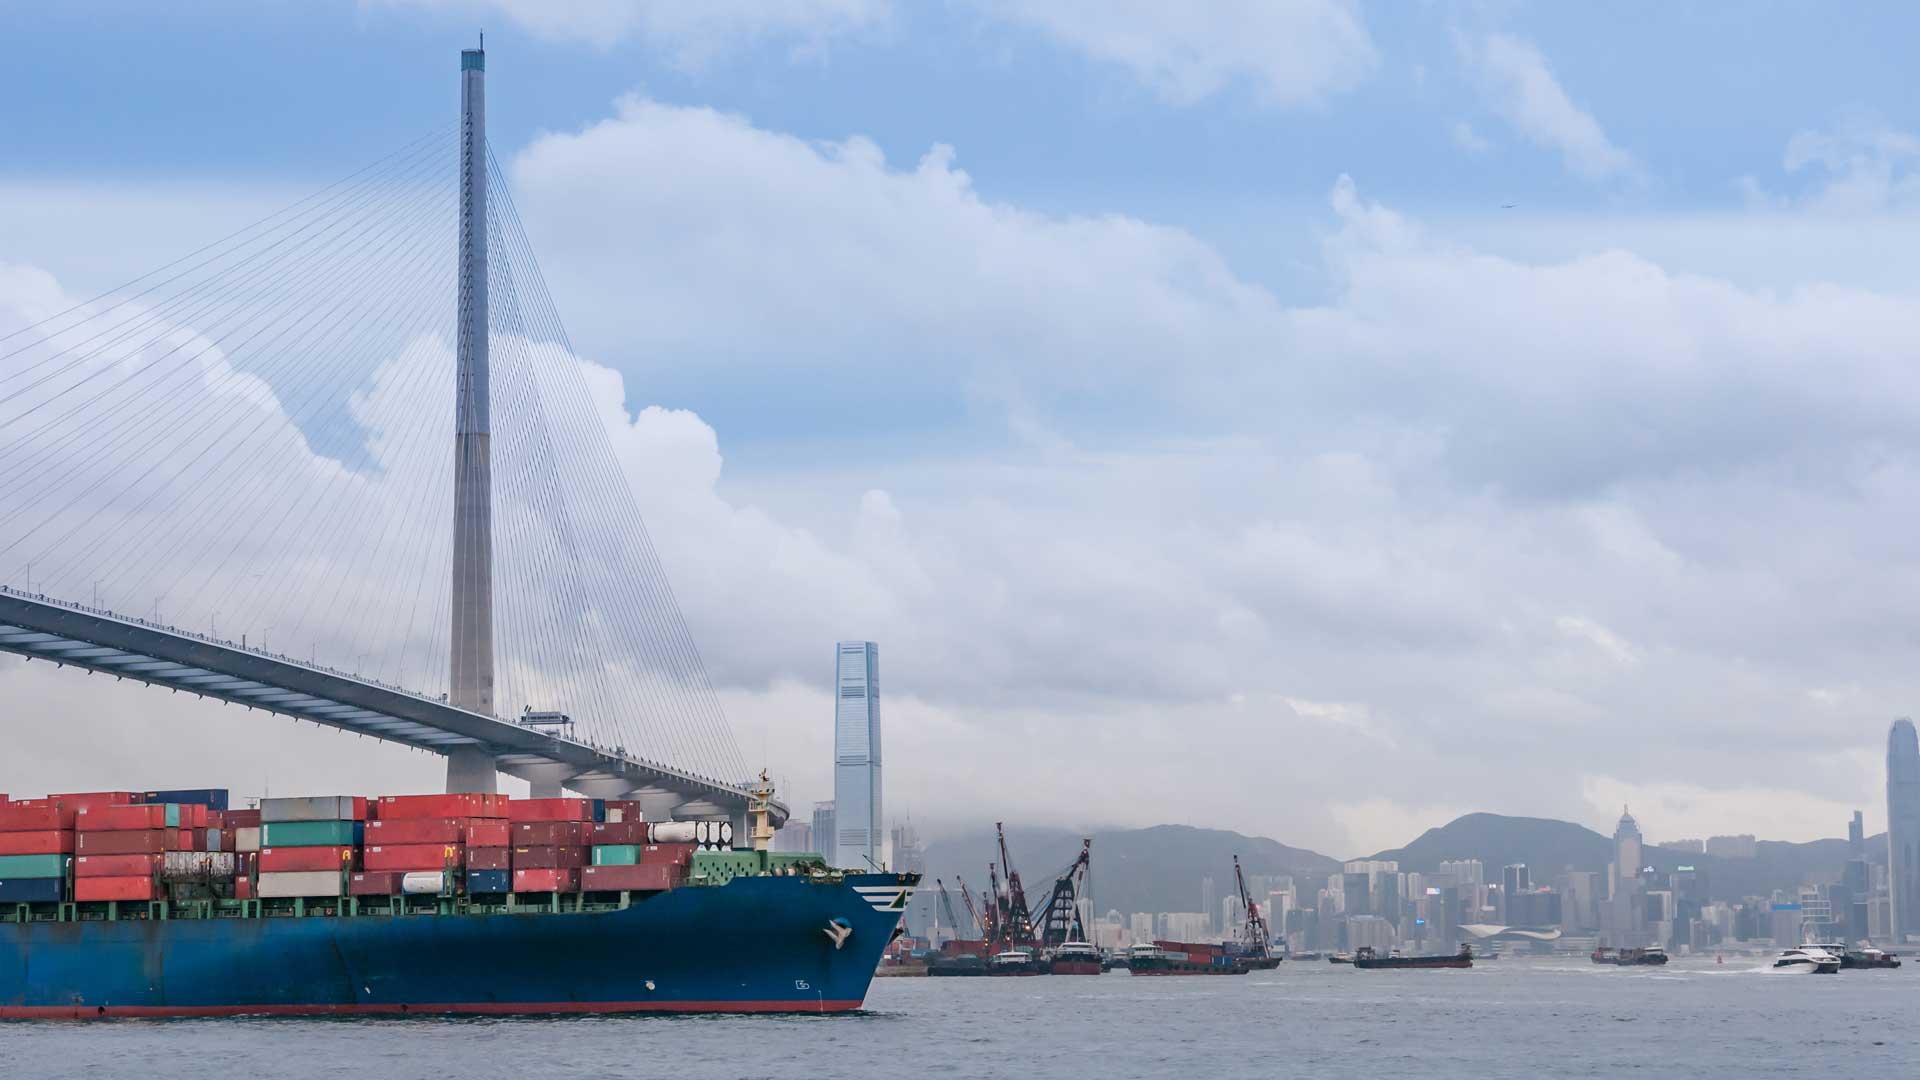
Cantonese speaking provinces stand out in particular as exporters. They include the province of Guangdong and the Special Administrative Regions (SAR) of Hong Kong and Macau. Three of the largest ports in China (outside of the SAR) are located in the Cantonese cities of Guangzhou (Canton), Shenzhen, and Dongguan. They are all located in the Pearl River Delta, which is fast becoming a mega.
Hong Kong's export value equals about 143% of its total GDP. One of the main reason for this is that Hong Kong is a major player in reexportation. Chinese mainlanders avoid paying more high taxes at home by selling goods at near cost price to affiliates in Hong Kong. There, the goods are marked up before being exported to the rest of the world. The earnings are then booked in Hong Kong, which has a much friendlier corporate tax rate that allows mainland Chinese companies and their Hong Kong affiliates to earn a higher net profit.
In terms of percentage of GDP, Shanghai exports the most in mainland China (which excludes both Hong Kong and Macau, both SAR). Shanghai exported USD$183.5 worth of goods in 2016, good for 43.25% of its GDP. The port of Shanghai is by far the busiest in all of China and exceeds even Hong Kong.
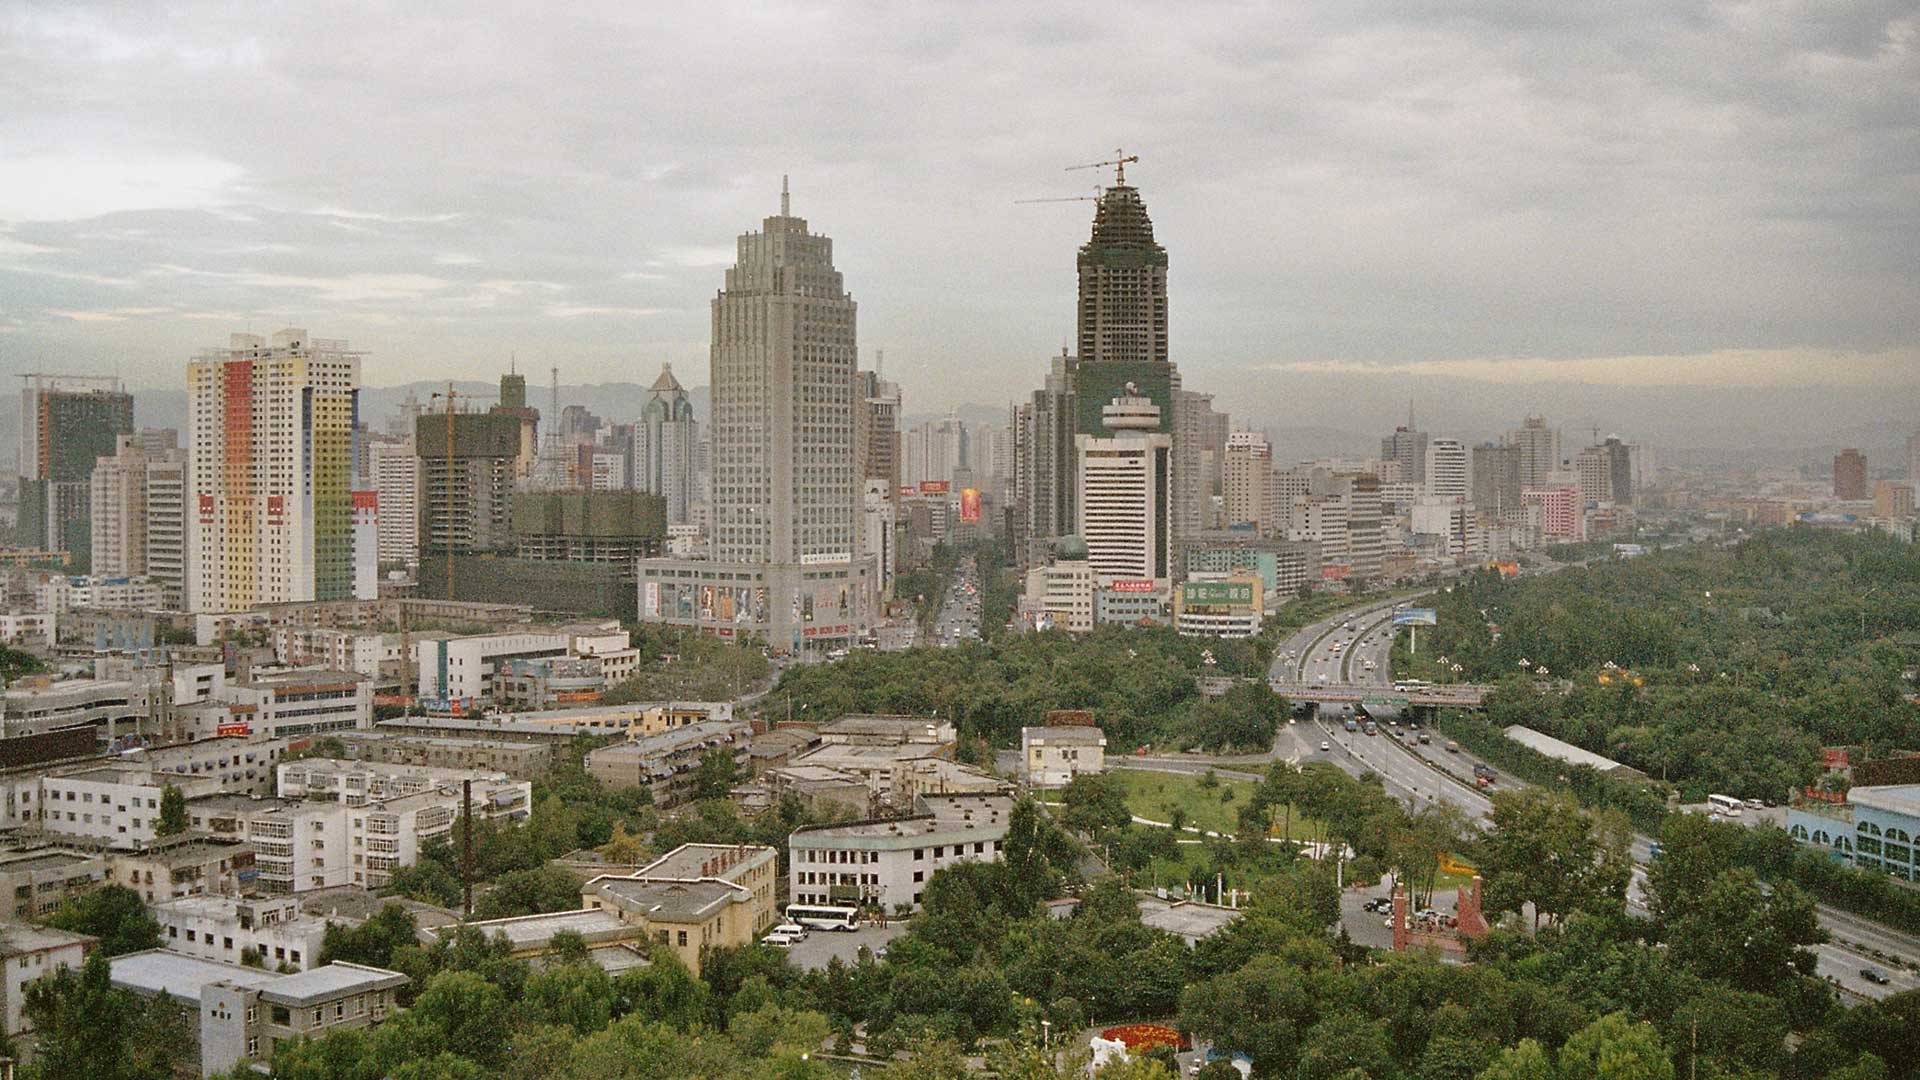
Xinjiang ranks 20th among the provinces. But expect Xinjiang's ranking to rise in the coming years as China devotes more resources towards developing the market, industry, and infrastructure of both its inner regions and their Central Asian neighbors. China sees Xinjiang as their gateway into Central Asia. Not only is Xinjiang next to Central Asia, but its native Uyghur people are also more culturally similar to the people of Central Asia than they are to the Han Chinese.
Inner Mongolia's economy is the least dependent on export, at least to places outside of China. Its export value amounts to only 1.6% of its GDP, the least of any Chinese province. But this export value doesn't take into account Inner Mongolia's exports within China. Inner Mongolia is relatively rich in fossil fuels and mineral resources like rare-earth, so Inner Mongolia helps provide the raw material that fuels industry in China's other provinces.
Tibet exports the least. Tibet is a landlocked province located in a mountainous area with relatively little people (3,180,000 as of 2014) and underdeveloped infrastructure.

Conclusion
In the summer of 2016, Xi Jinping, president of China, said that "No region or ethnic group can be left behind", when he visited Ningxia, a province in the landlocked west and one of China's. China's coastal provinces not only export the lion's share of China's goods but also make up a large chunk of the country's GDP. But the coastal province's share of both the country's GDP and its total export volume may become less disproportionate in the future as China shifts more focus towards the development of its interior regions.
One of China's strategy to develop its interior is proposed in the "One Belt One Road Initiative". It includes plans to further integrate China with countries situated along the ancient Silk Road through trade and investment, particularly in infrastructure. As outlined the in the initiative, China plans to invest upwards of USD $1 trillion towards developing infrastructure. This will not only help fuel growth in Central Asia's underdeveloped markets but will also help build stable transportation routes to link China with more lucrative customers in Europe. In January 2017, the first freight trains from China managed to deliver consumer goods directly to the UK.